Measuring Global
Water Security.
Water Quality Impairment at Scale
drink microbially contaminated water
threatened by water insecurity
half from water management, half from unmanaged human wastewater
fail Clean Water Act standards
Climate change is here — and the first thing most of us notice is what it's doing to our water. Dry places are becoming drier, with droughts driving crop failure, livestock death, and displacement. Wet places are becoming wetter, with flooding destroying communities and contaminating drinking water. Because of what we've done — through causing climate change and treating water as free — we can't count on water being where we need it, when we need it anymore.
Currently four billion people experience water stress. The United Nations projects that water insecurity will displace at least 700 million more people by 2030. By 2030 nearly five billion people will experience significant water stress because of climate change — and most of the time there is still plenty of water. The problem is we don't conserve and protect it so it's there when we need it most.
Think of this map the way you think about the Earth at night seen from space — the bright spots show you where rich people live, not where people live. This water quality map is exactly the same. The dense clusters of measurement data show you where wealthy countries have invested in monitoring infrastructure. Over three billion people, nearly half the world's population, use firewood every day for cooking and staying warm. This is also where they live — and it's almost invisible on this map. These are the people facing the earliest and worst effects of climate change on their water, and they are almost entirely unmonitored.
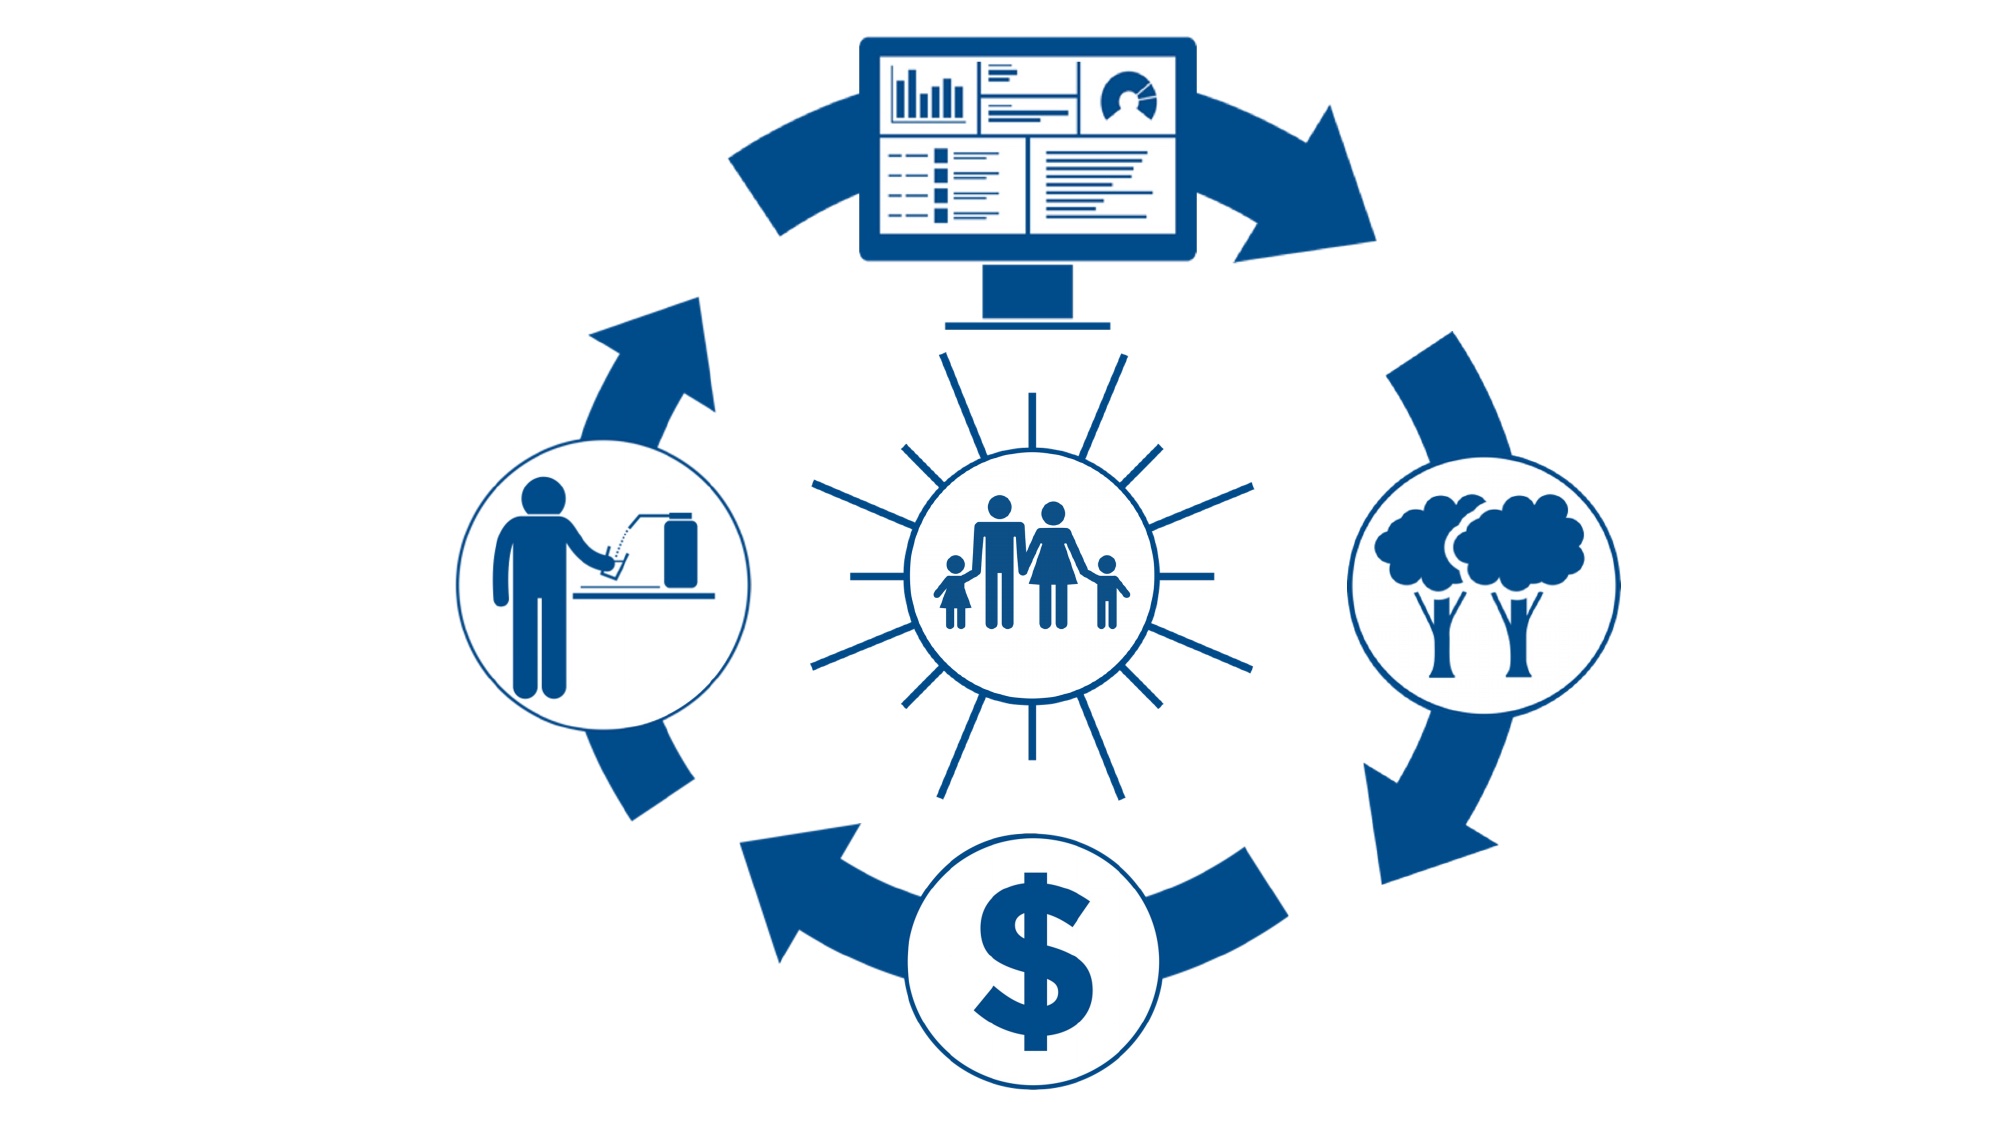
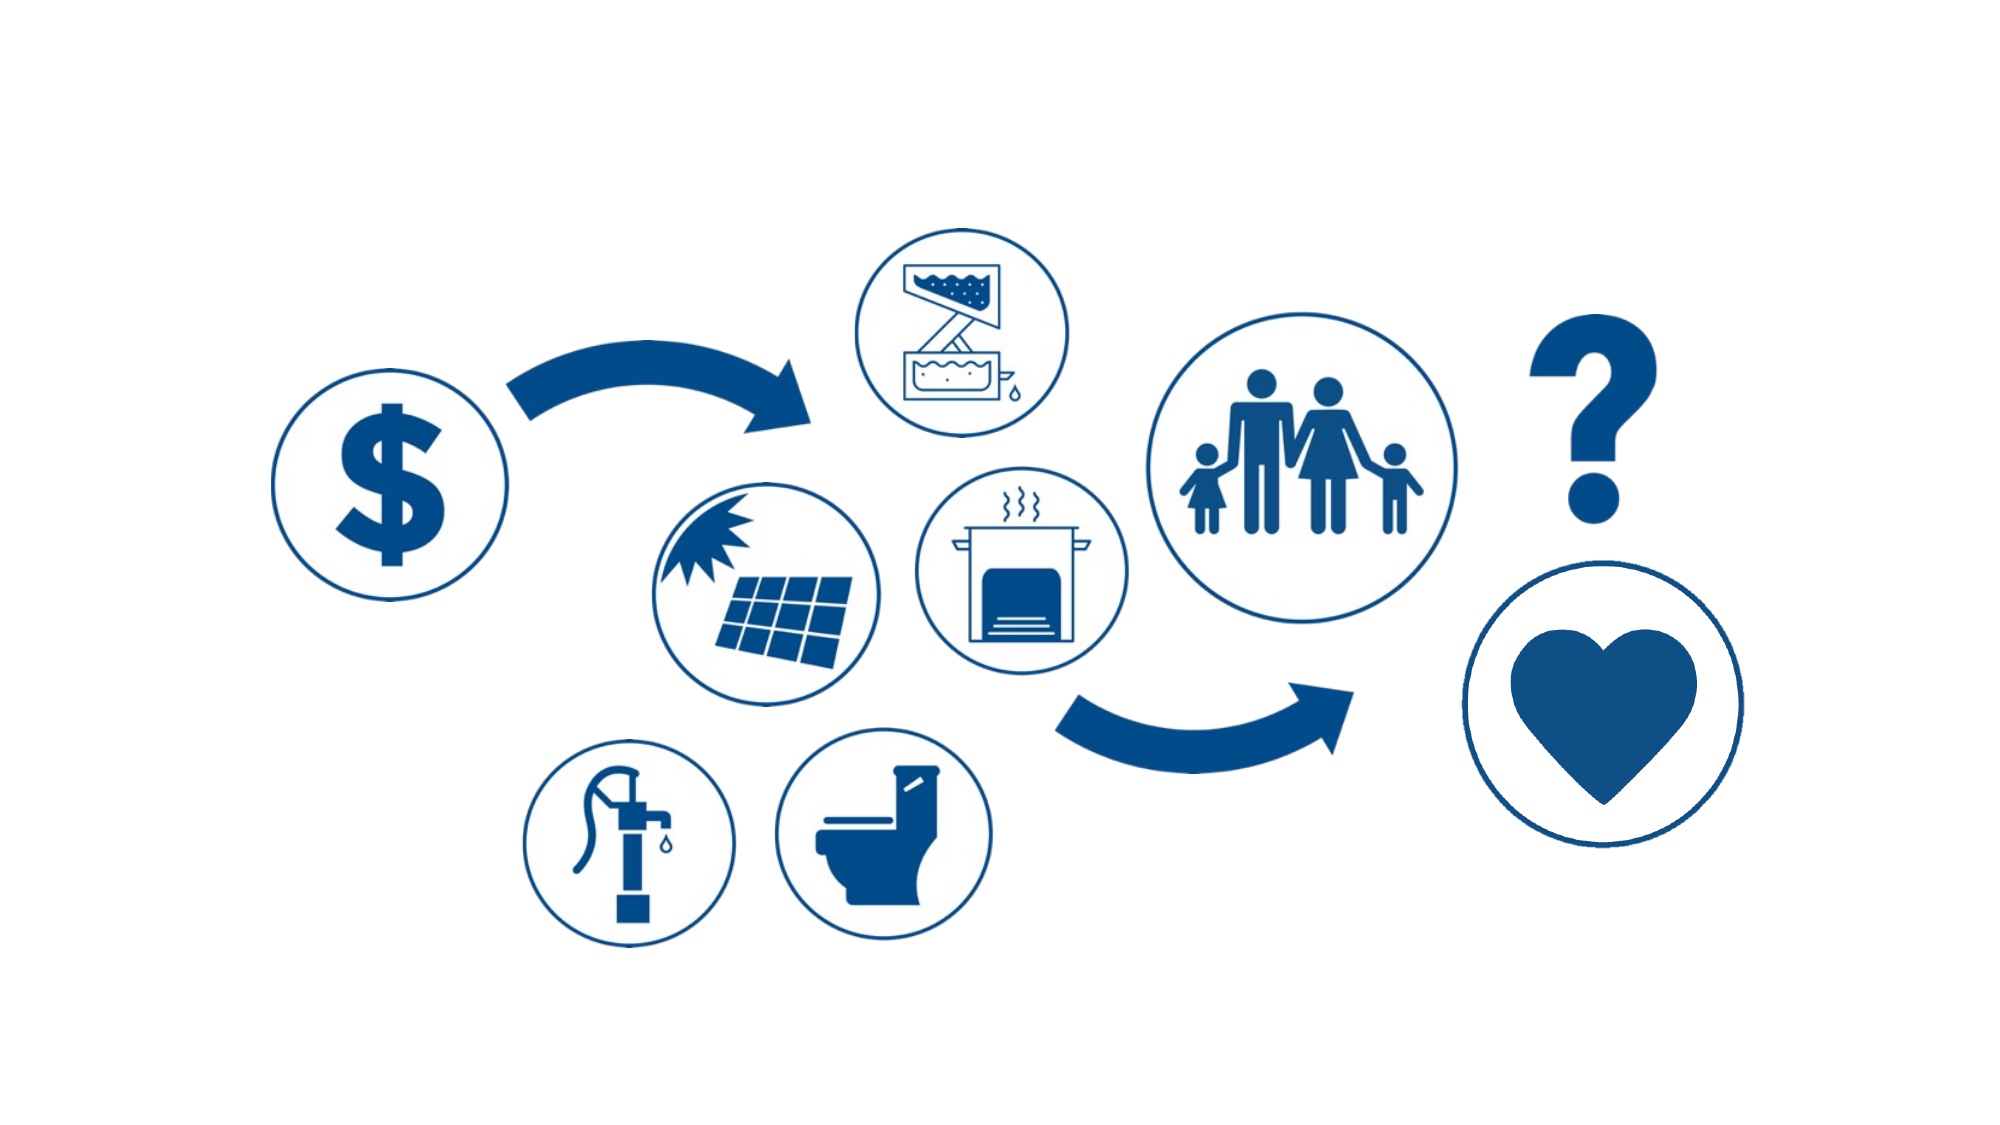
This is how the global WASH sector has thought about clean water for fifty years. You raise money — from donors, governments, sometimes private capital. You buy hardware: water filters, hand pumps, cookstoves, solar systems, latrines. You hand it to families. You hope they use it. Outcome: better health. That's the conventional model — linear, one-shot, hope-based.
It is also why the global WASH sector has been struggling for twenty-five years. Hardware gets distributed; nobody knows if it works in practice; the next round of funding asks the same questions. The piece this picture is missing is what comes next.
The big idea is to take the fast-growing world of climate finance — things like carbon credits — and turn it toward solving water problems. A carbon credit is a financial commodity worth about $20 today, representing a tonne of CO2 removed or not emitted. There's a multi-billion dollar market for carbon credits, and it's growing fast.
Carbon credits work because the atmosphere mixes — it really is legitimate to reduce emissions in one place to offset energy use in another. This hasn't been true for water. Save water in Colorado, it does nothing for Rwanda. But if you create a financial instrument that rewards water conservation in Colorado or water treatment in Rwanda, that credit becomes part of a liquid market. It can be bought and sold and create revenue that incentivizes the actions we all need to take. Monitoring closes the loop — you can only pay for outcomes you can measure.
Global Mortality Among Children Under 5
Total deaths by cause, 1990–2021. Sources: IHME GBD 2021, UNICEF IGME 2024, WHO Global Health Estimates.
Extreme Poverty by Region
People living below $2.15/day (2017 PPP). Sub-Saharan Africa is the only region where absolute numbers are rising. Source: World Bank, 2024. By 2030, 9 in 10 people in extreme poverty will live in Sub-Saharan Africa.
Per Capita CO2 Emissions
High-income countries have the highest per capita emissions, while low-income countries with the greatest disease burden contribute the least.
Death Rate from Diarrhoeal Diseases
Annual deaths per 100,000, all ages. Disease burden tracks fecal contamination — Sub-Saharan Africa and South Asia carry it. Source: IHME GBD via Our World in Data.
Rwanda — Country Context
Key Indicators
- Population: 14 million (2024)
- GDP per capita: ~$800
- Under-5 mortality: 38 per 1,000 live births
- Over 80% rely on firewood as primary fuel
- Most rural households drink untreated water
Study Location
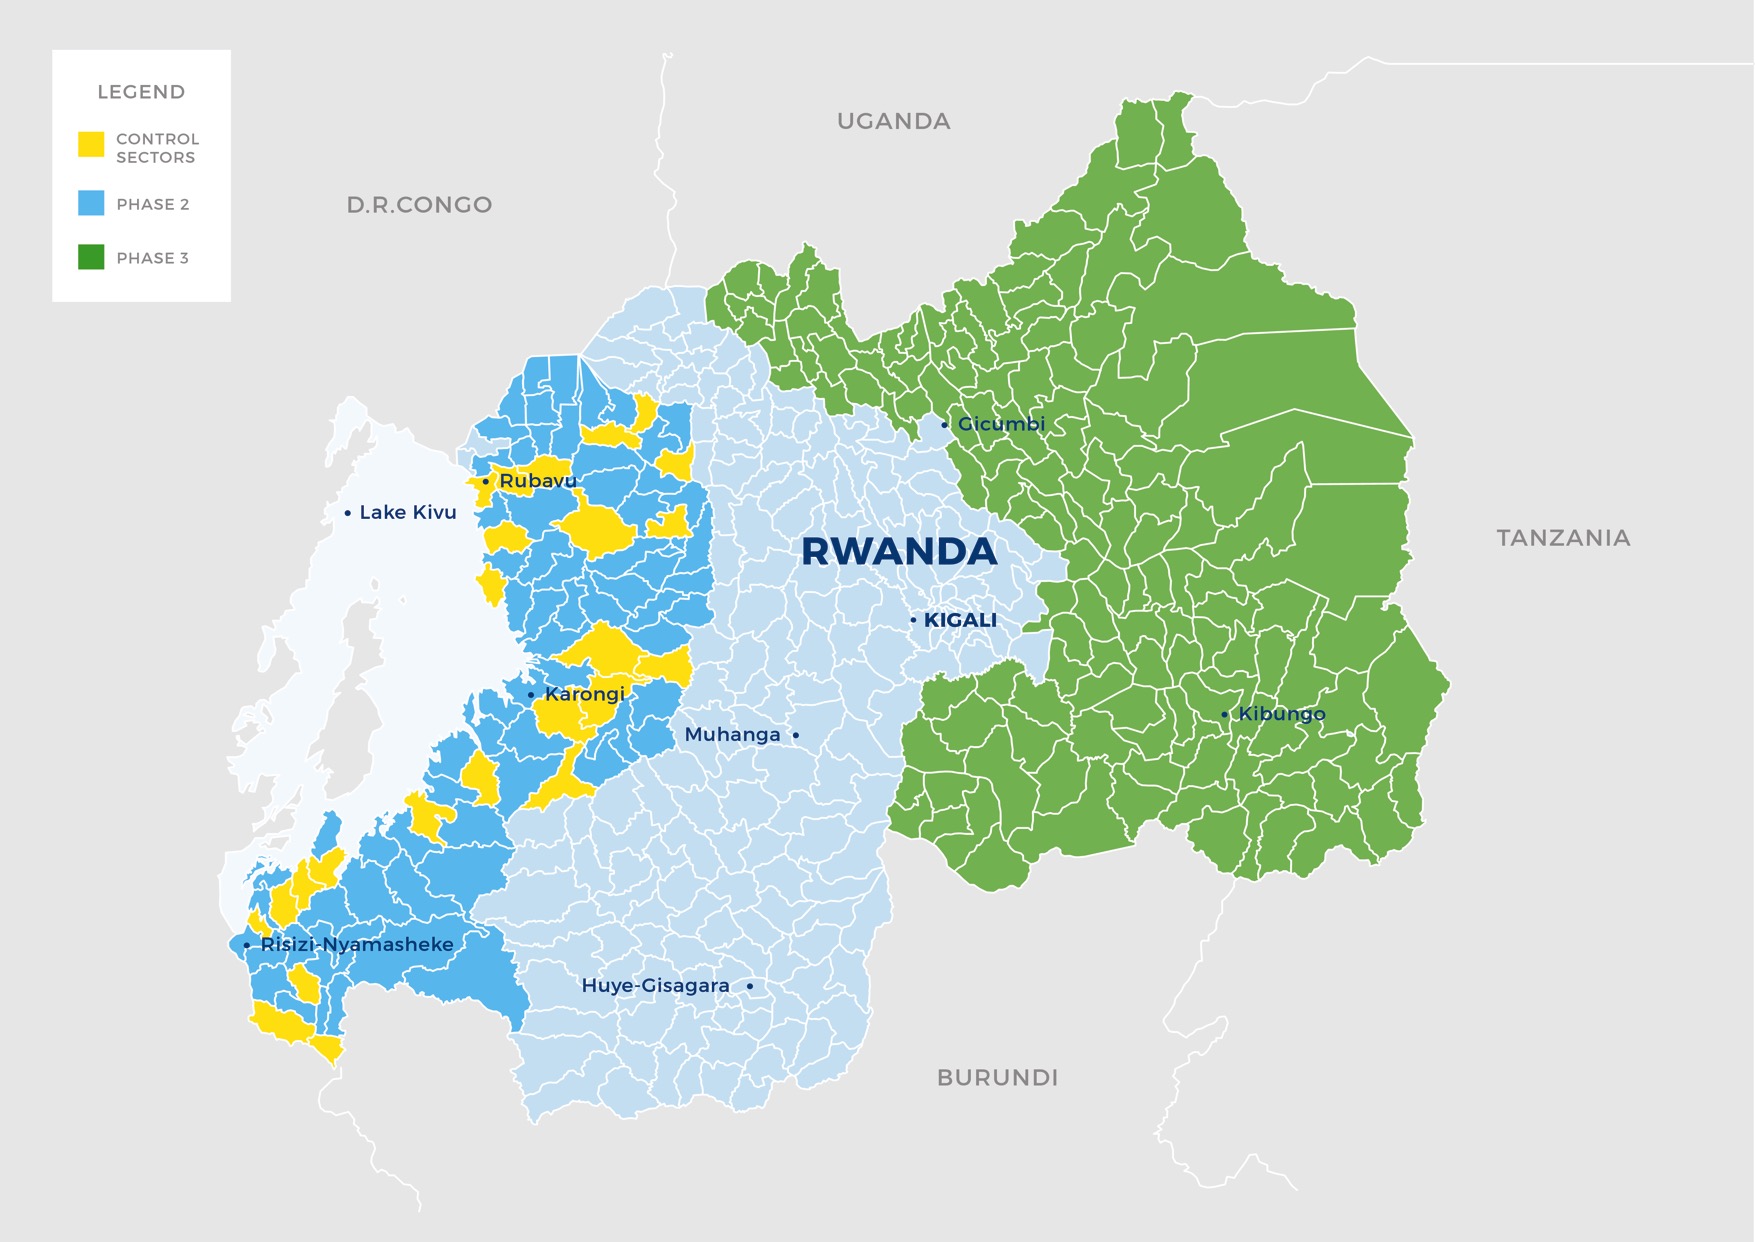
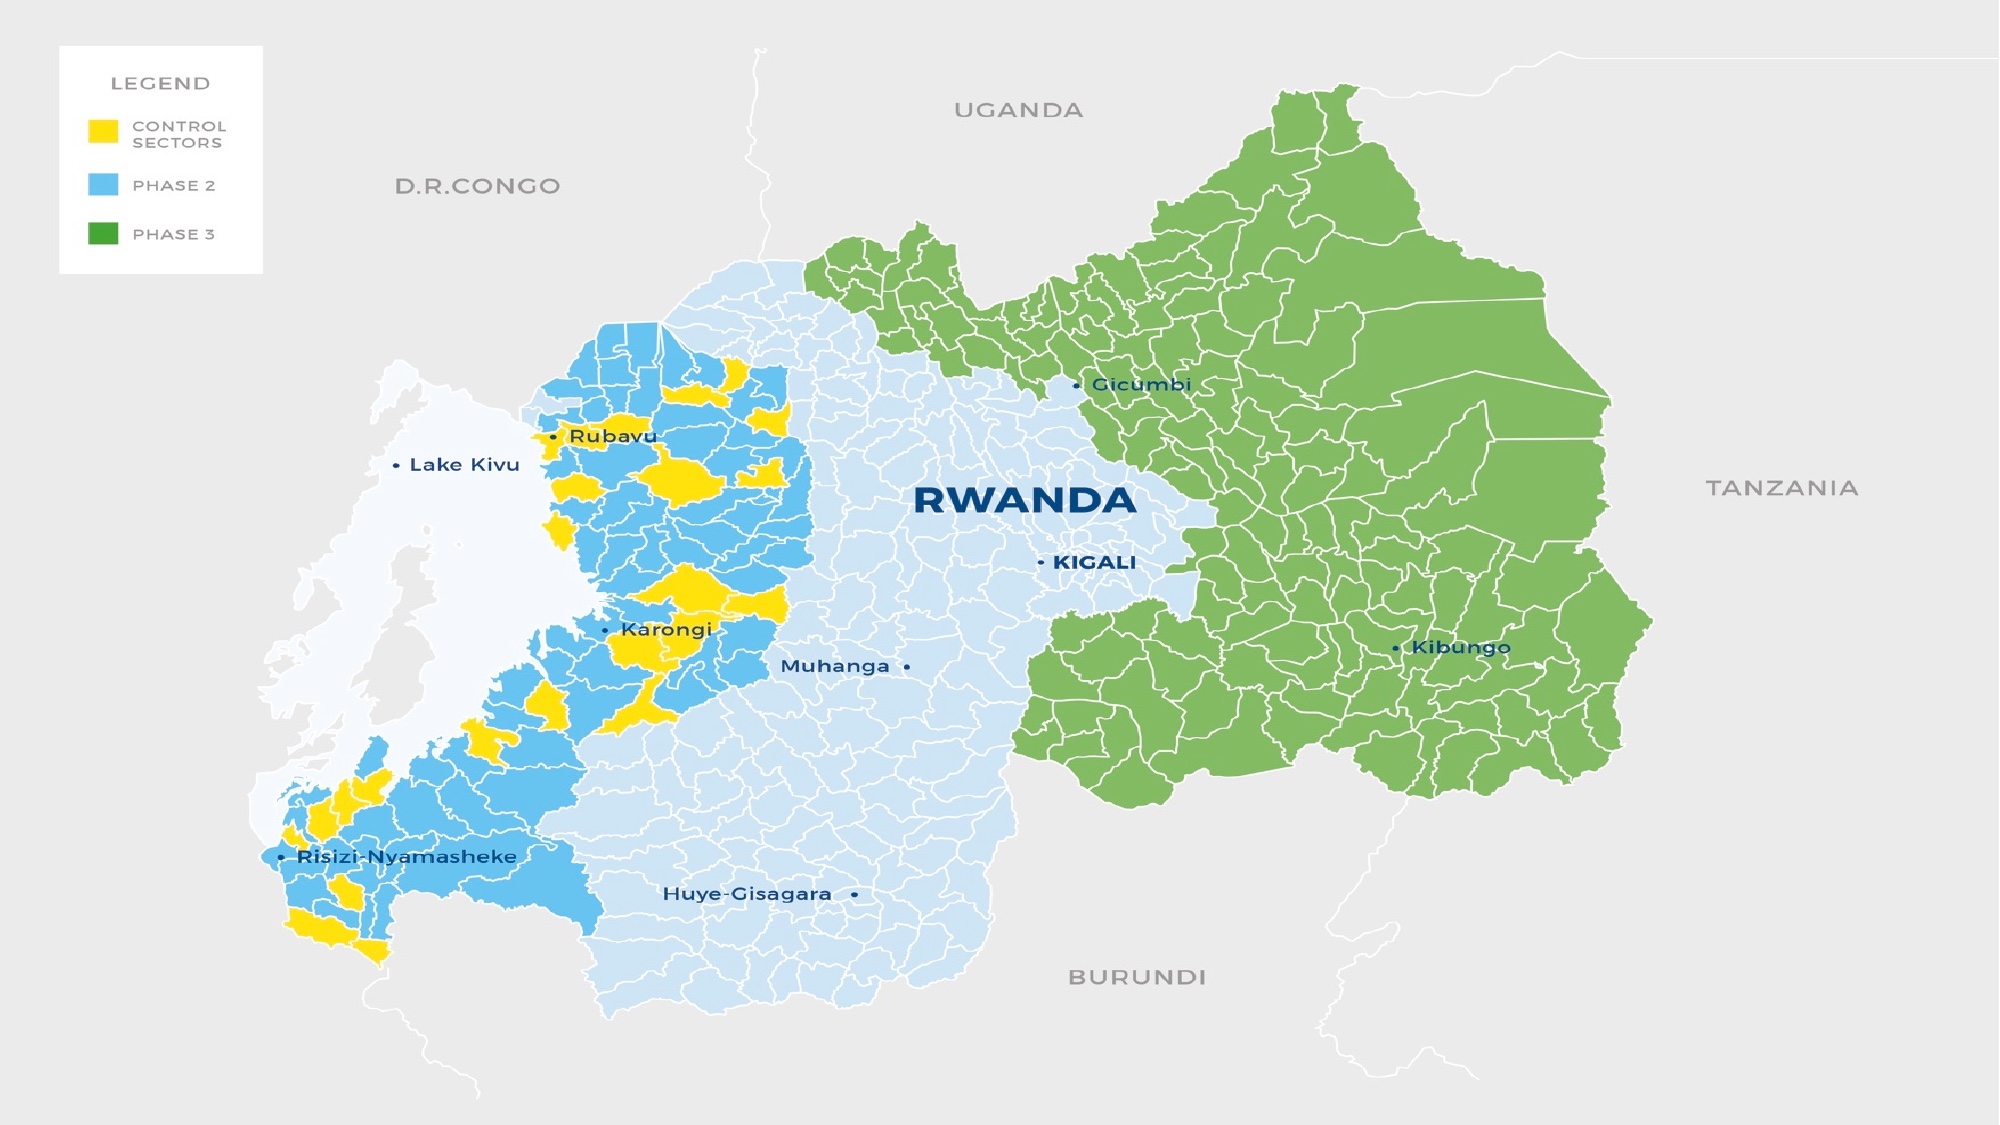
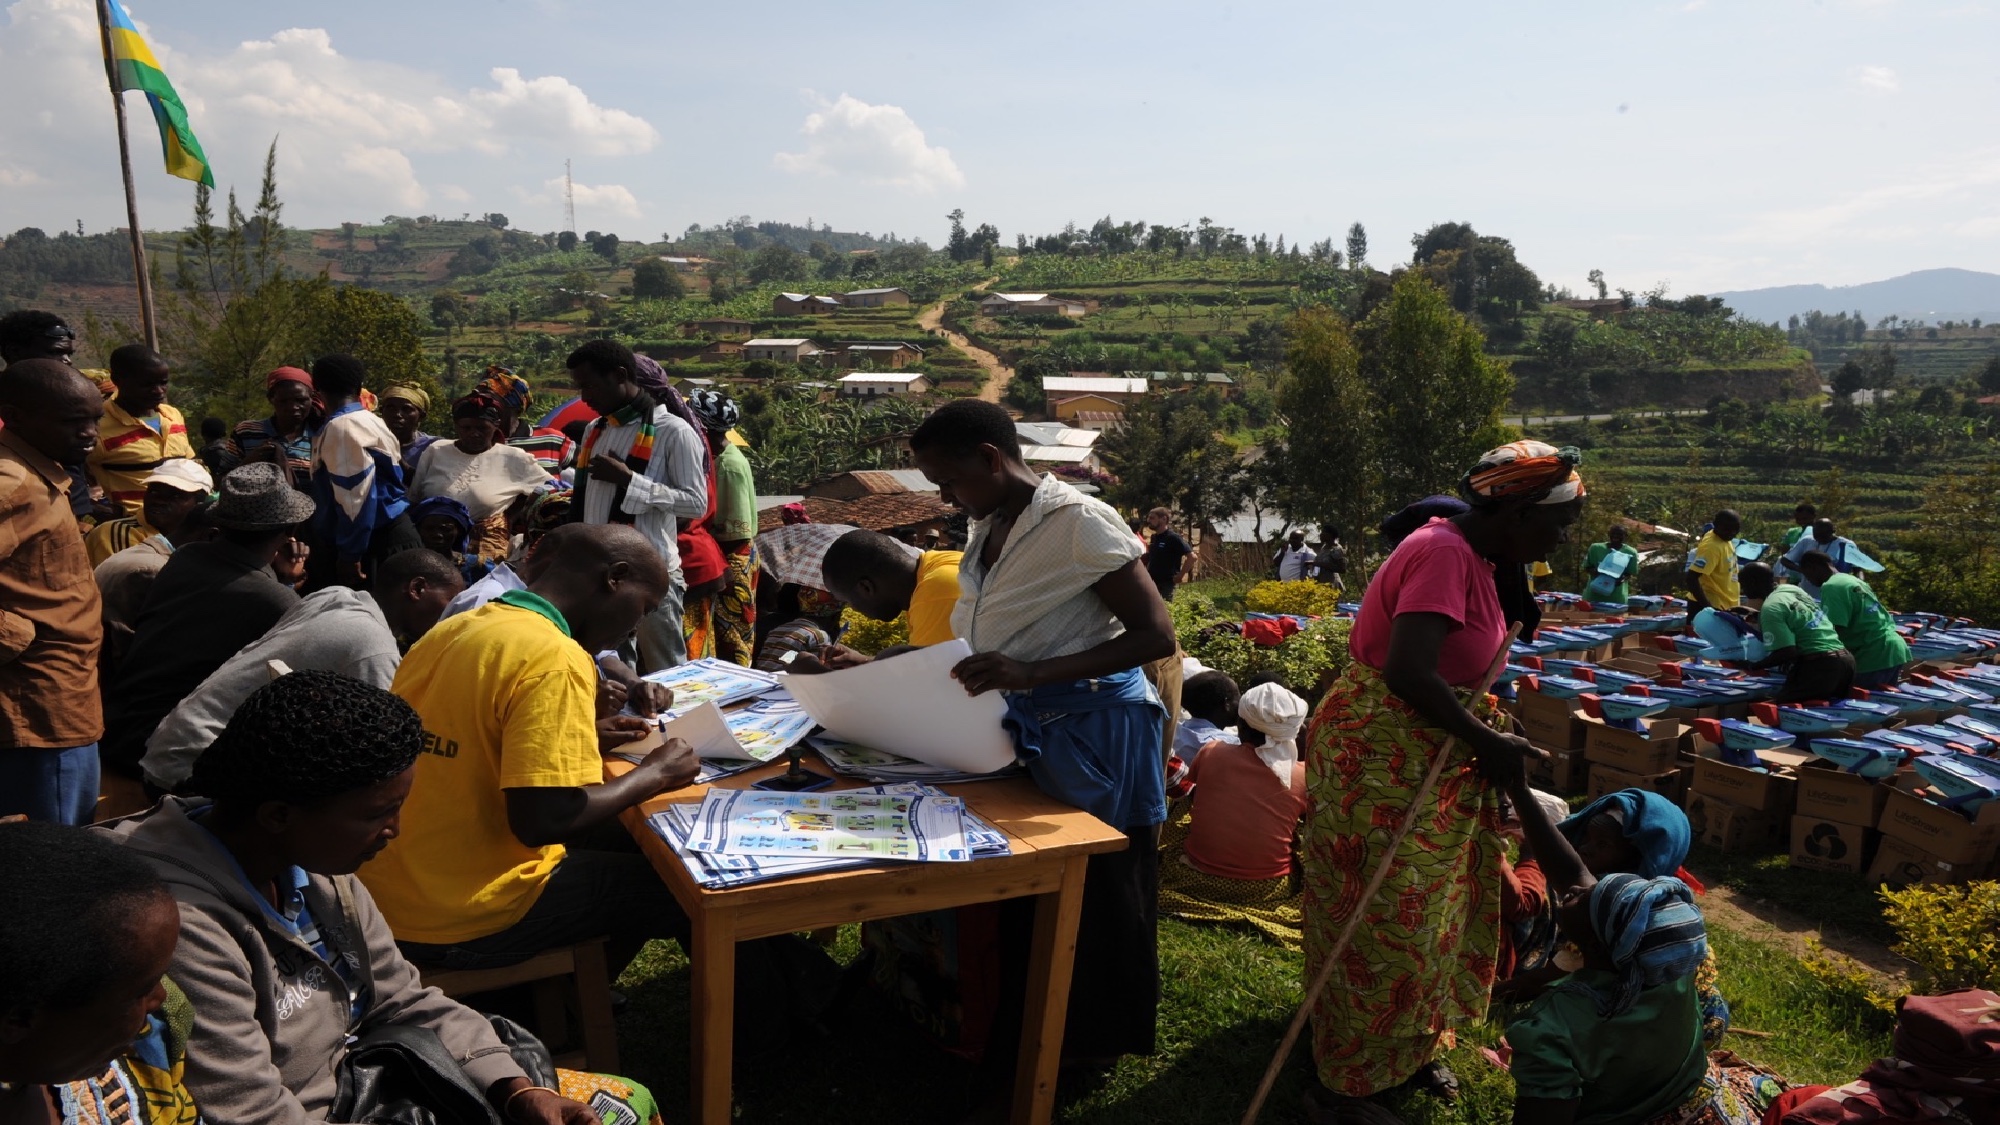
Western Province, Rwanda — 96 sectors cluster-randomized, reaching 101,000 households with water filters and improved cookstoves.
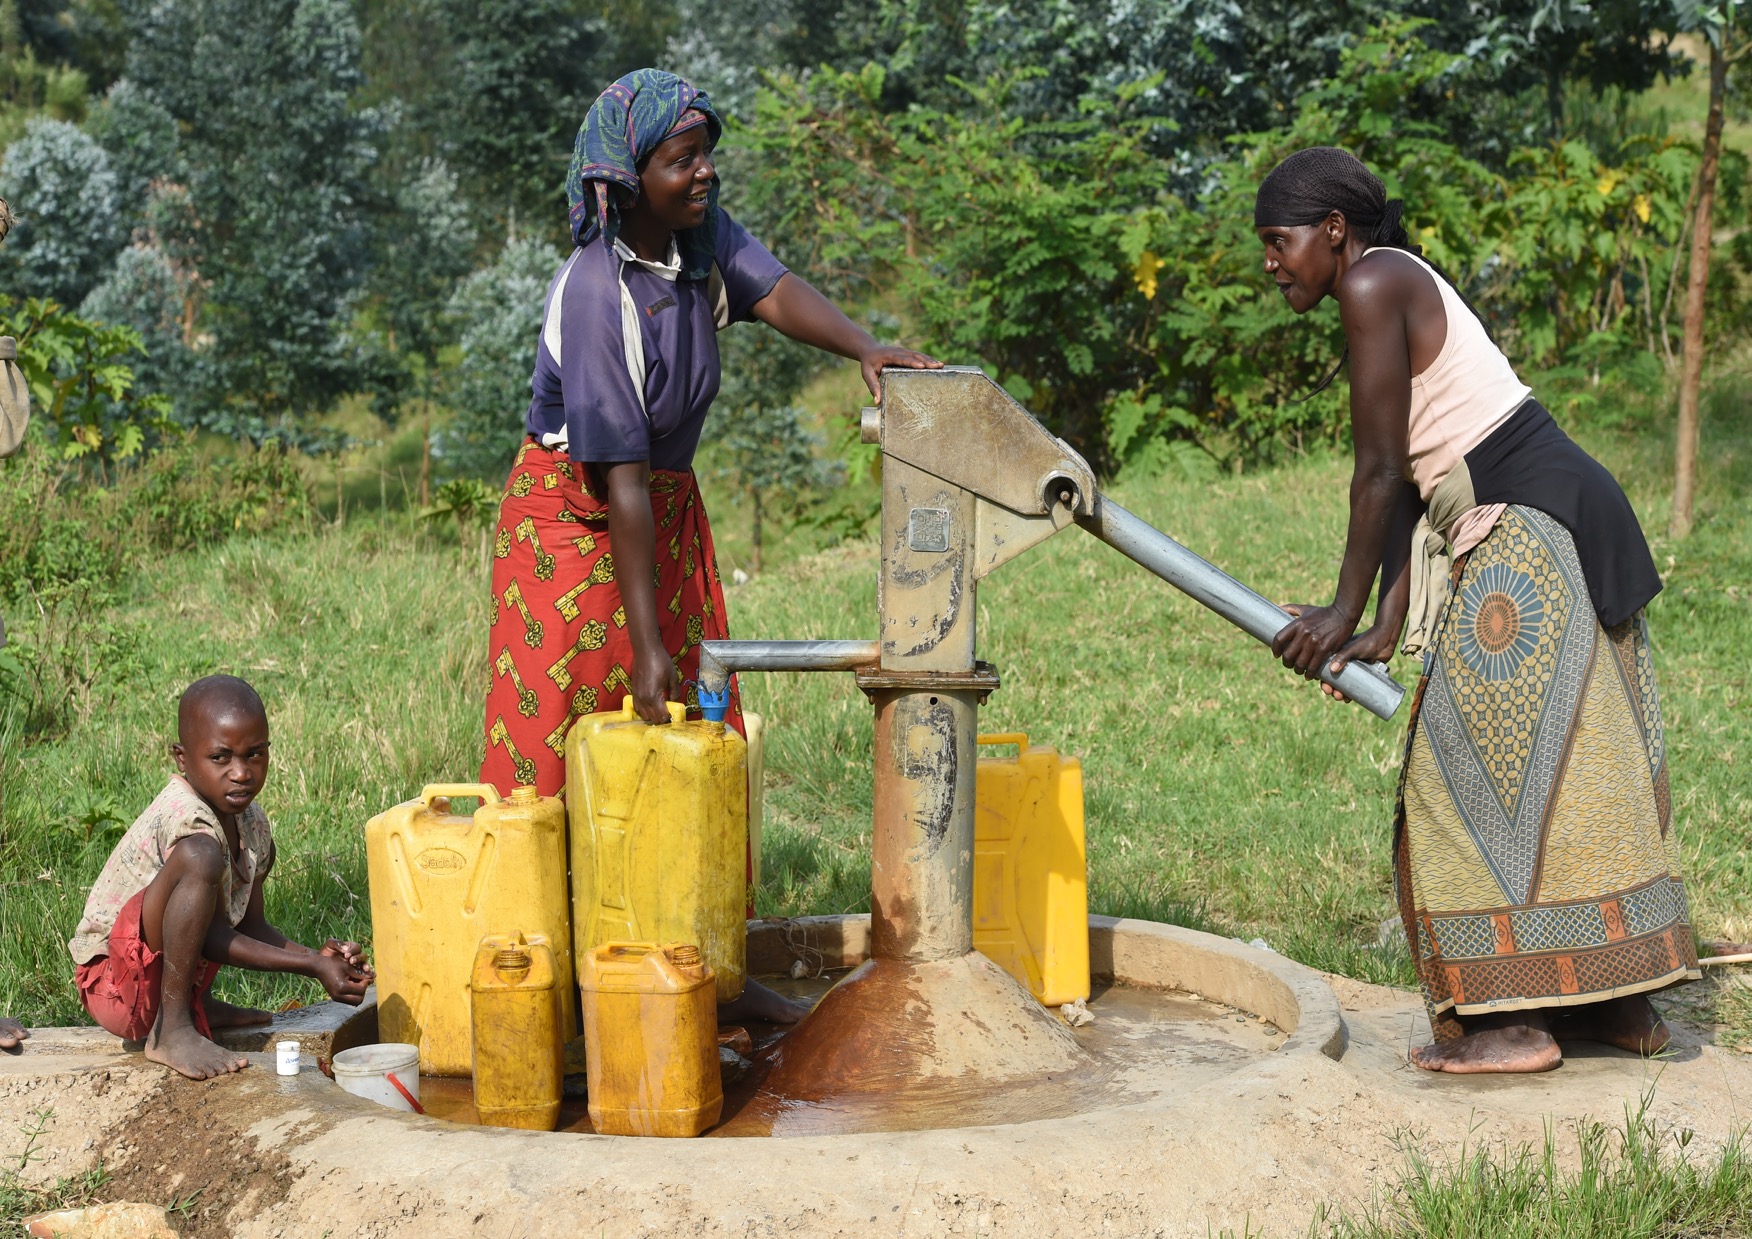
Programme Implementation
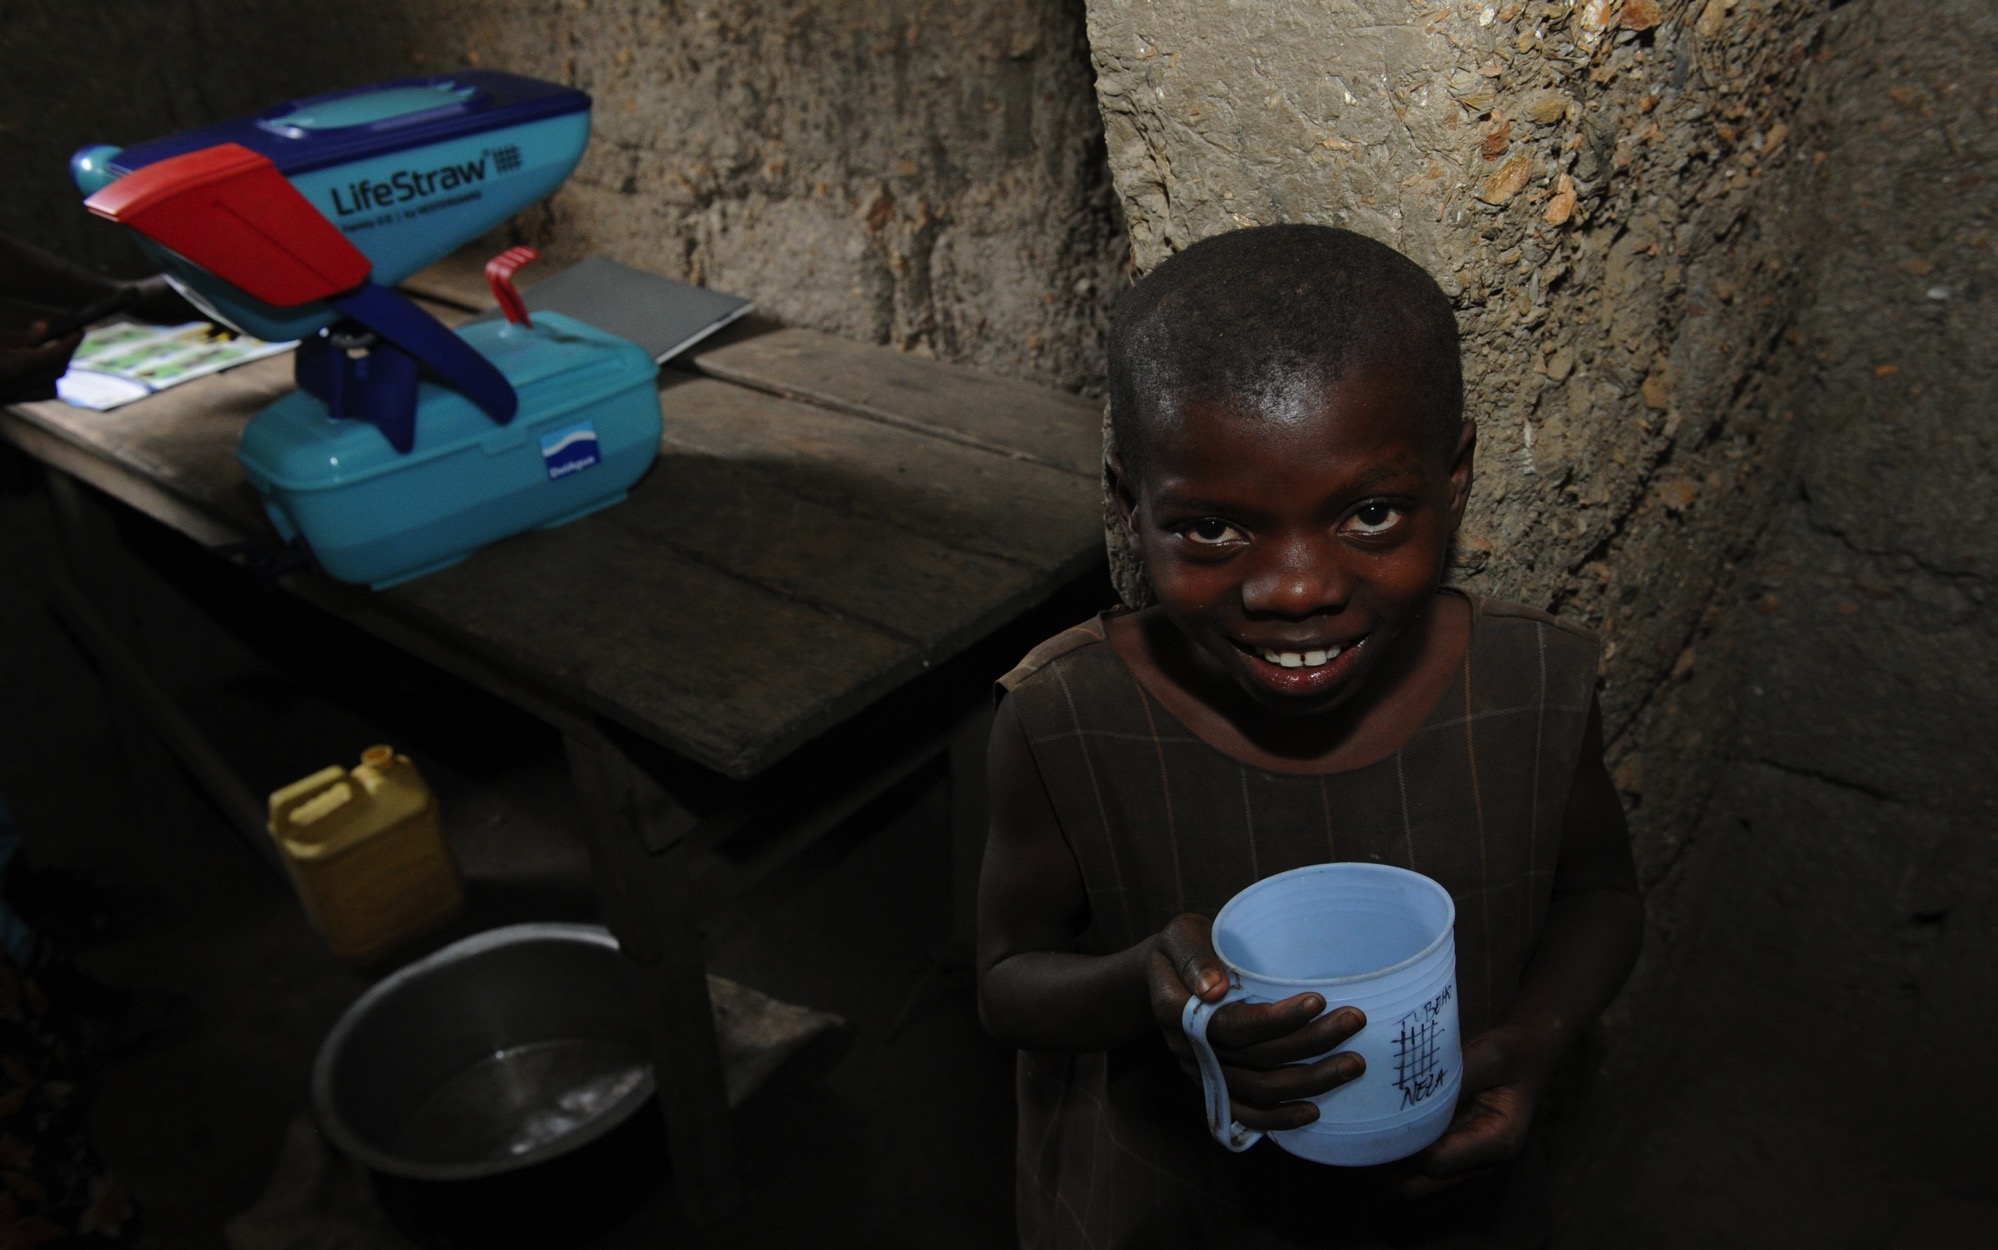
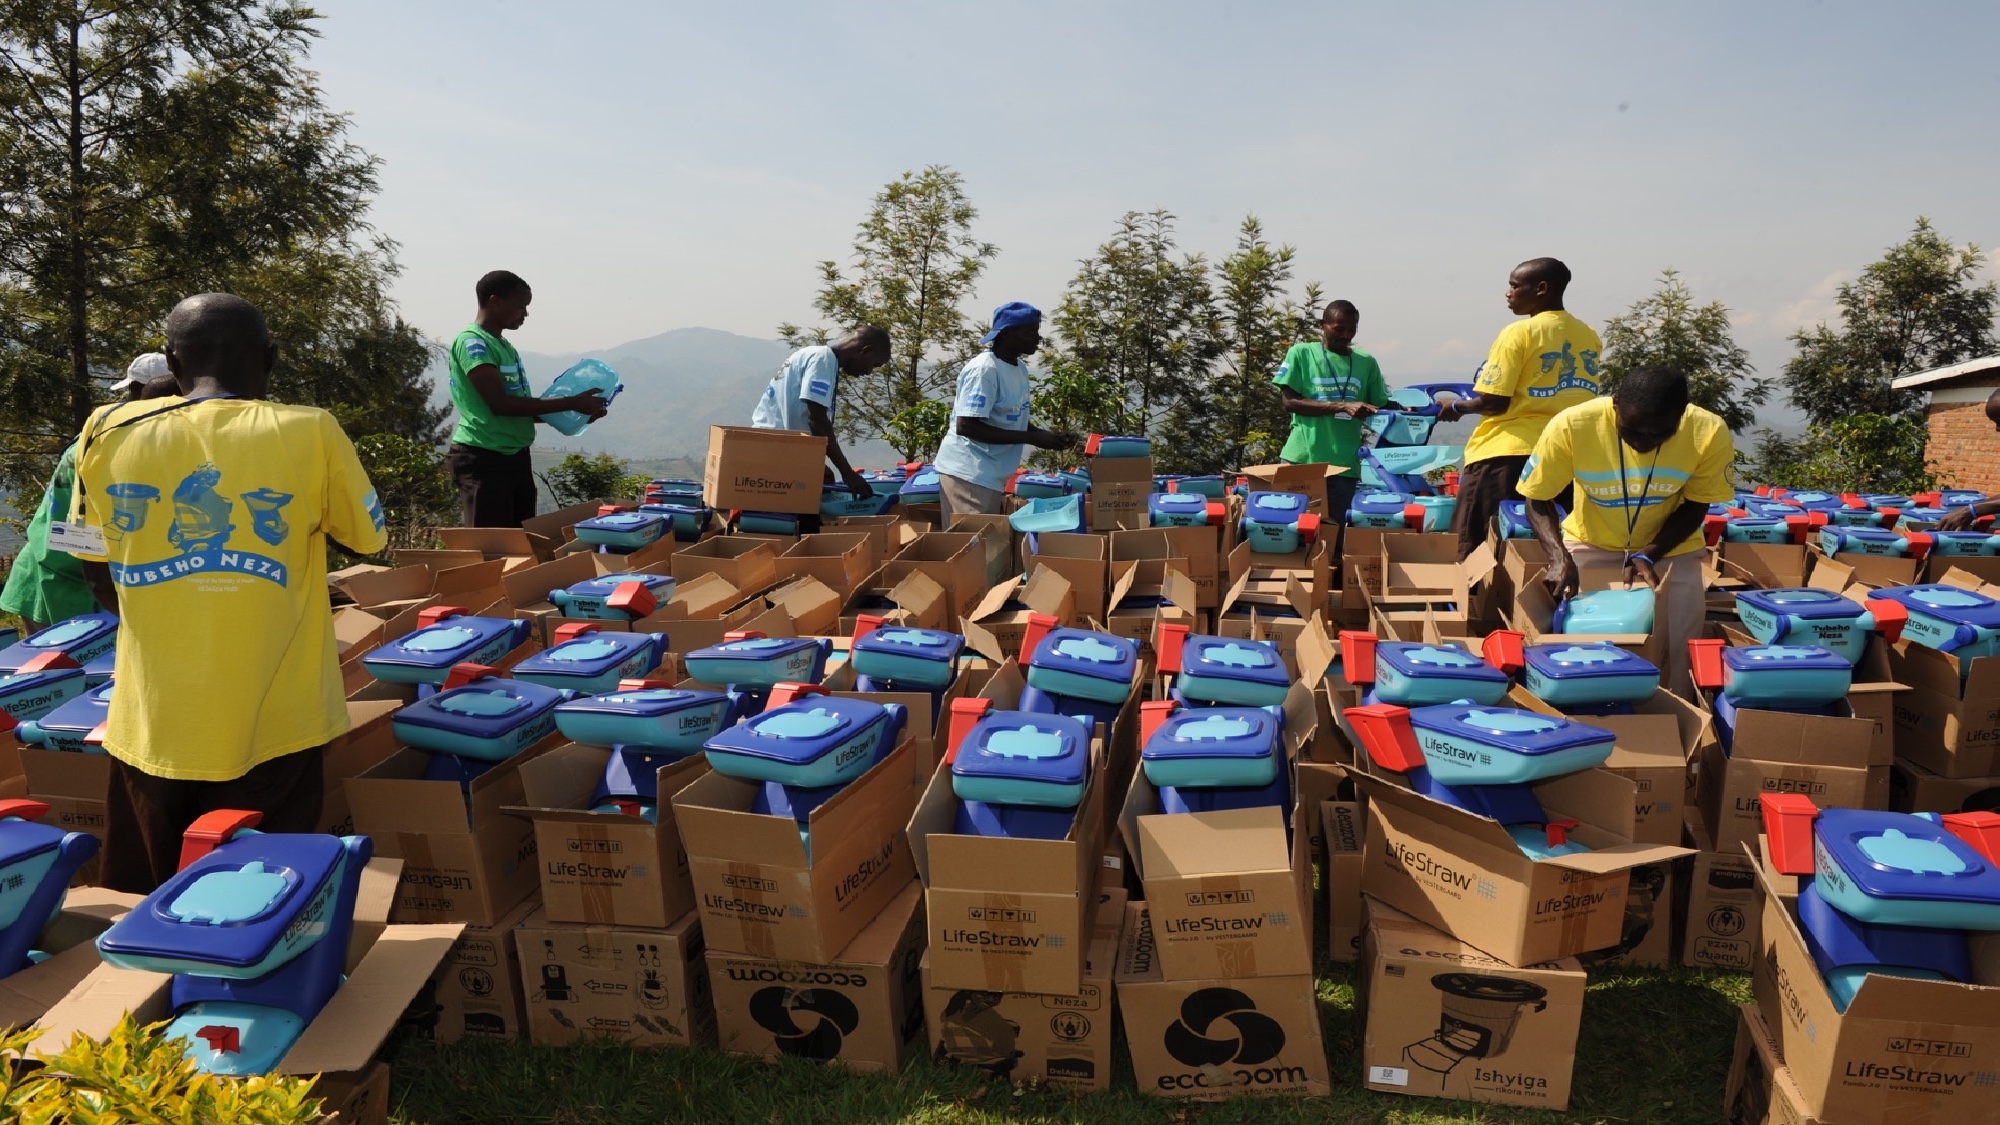
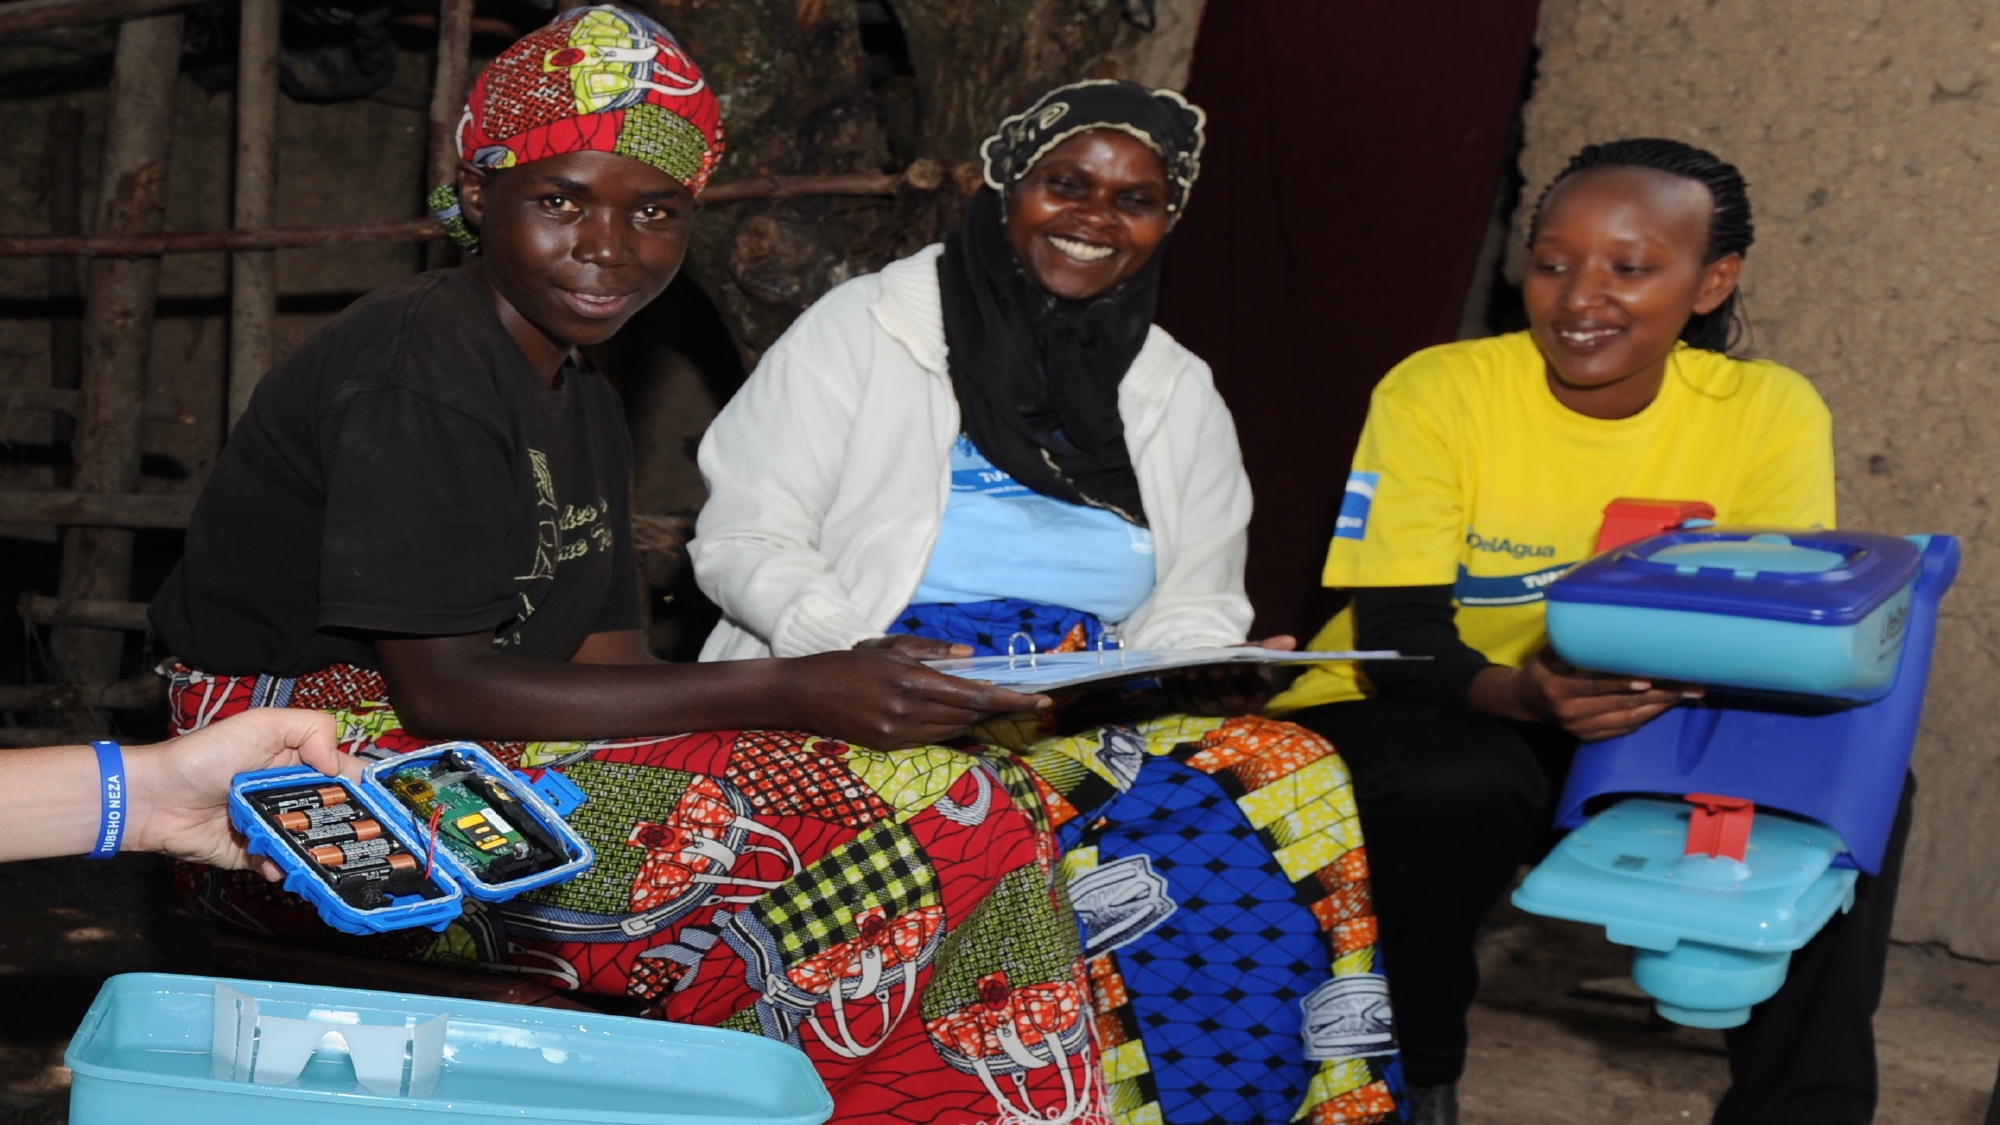
LifeStraw Family 2.0 water filter in household
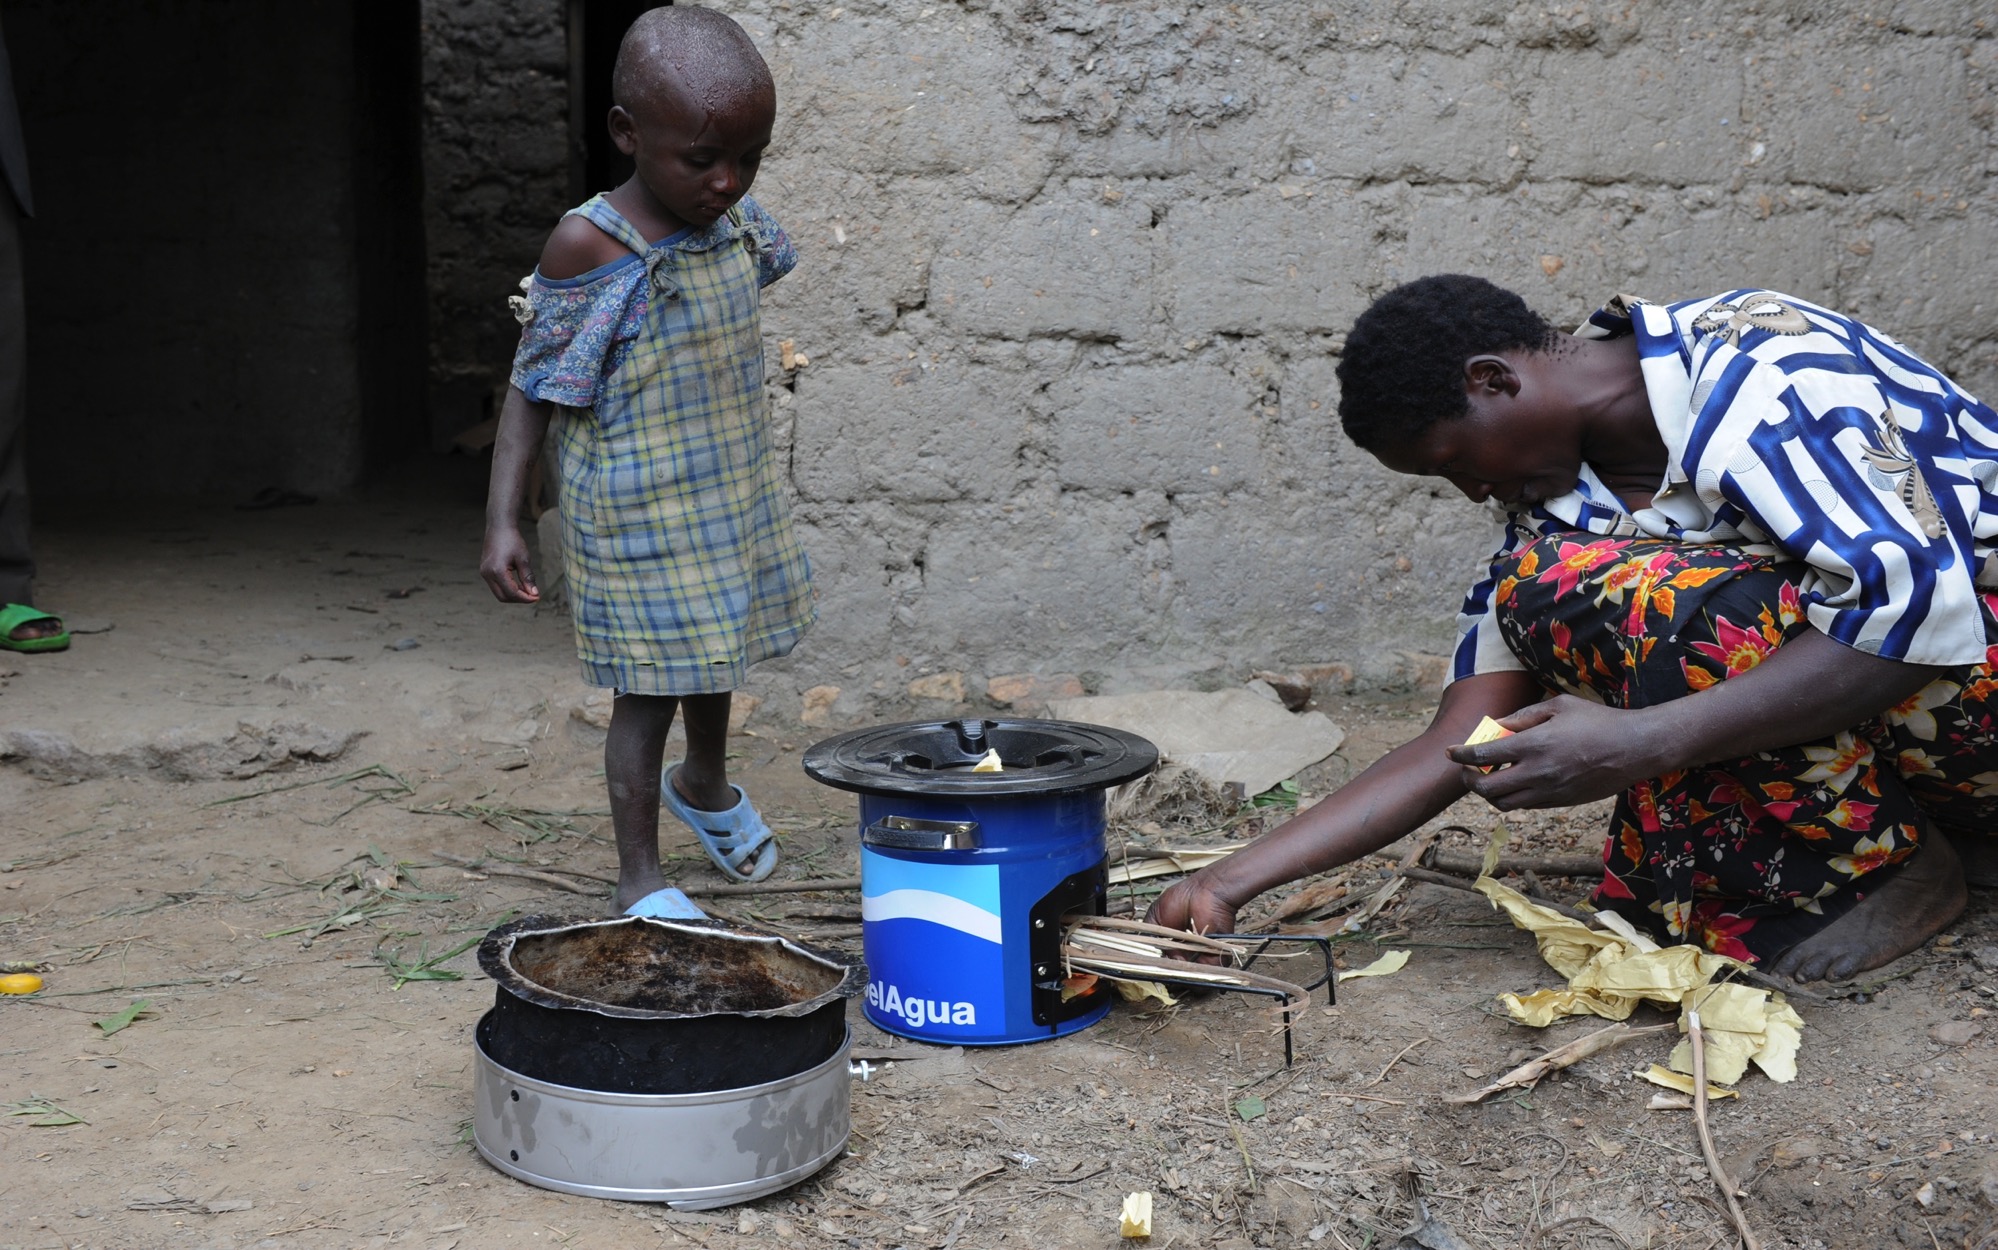
EcoZoom Dura improved cookstove in use
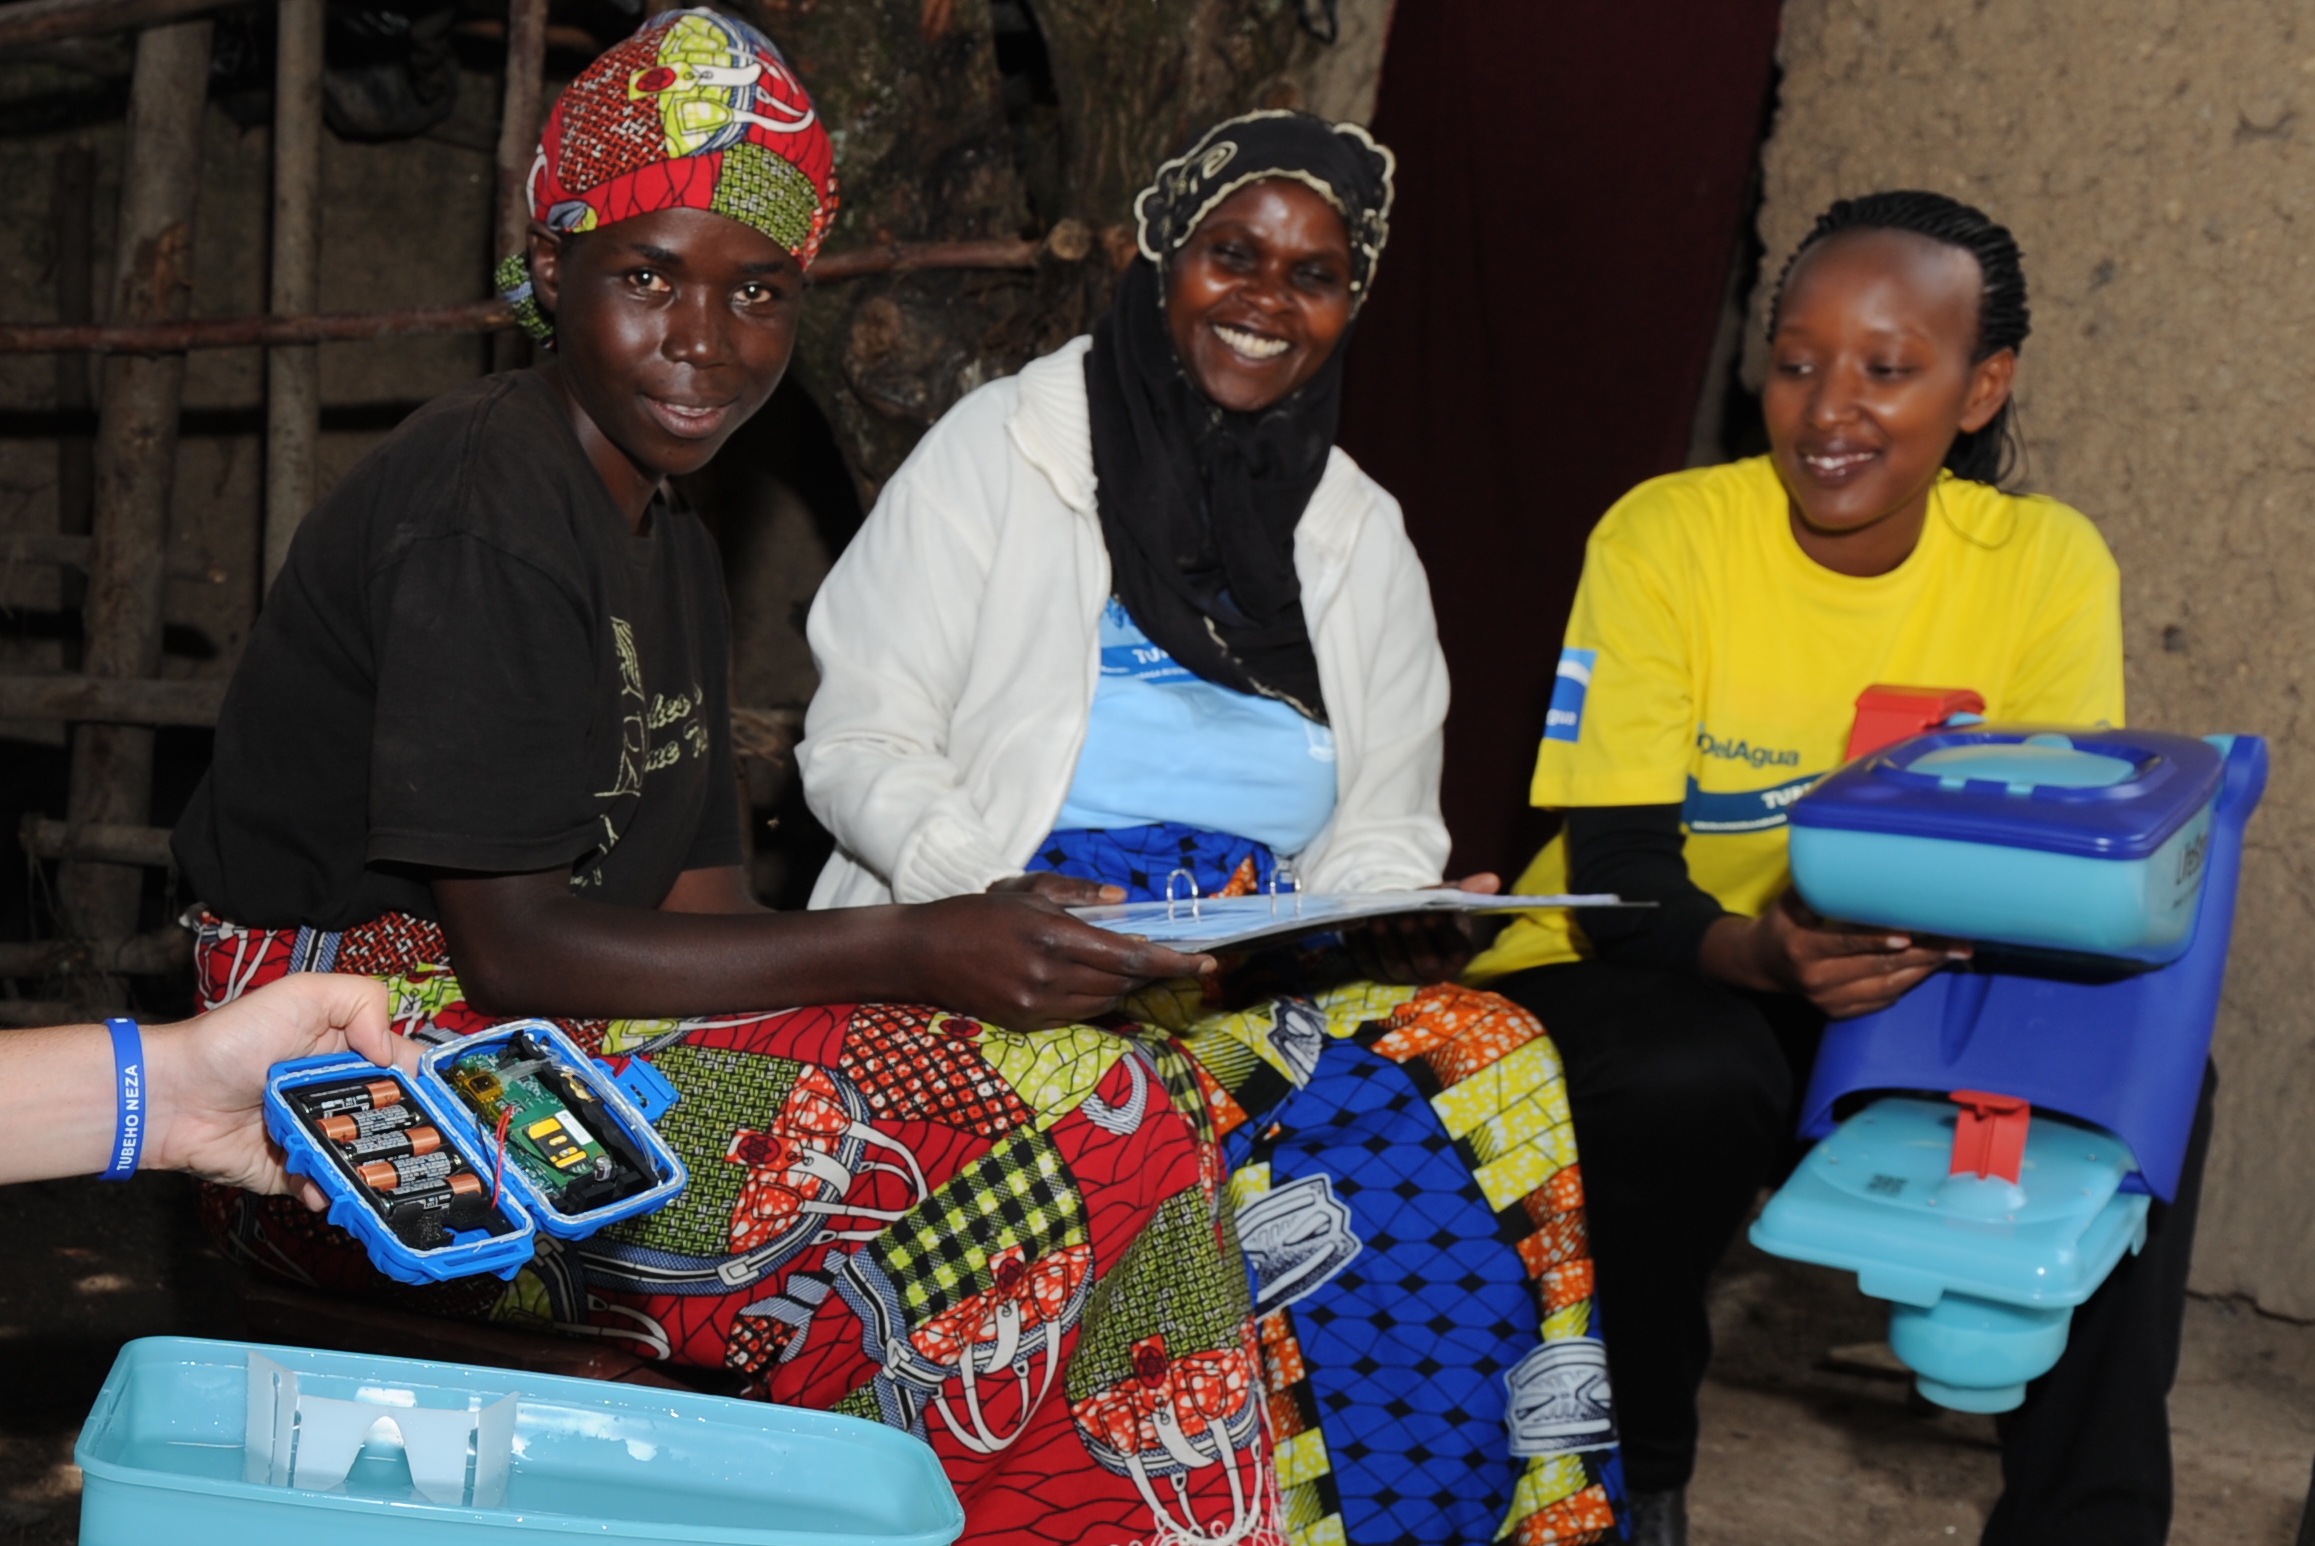
Electronic sensor monitoring deployment
Key Results — Tubeho Neza Trial
Health Outcomes (Children Under 5)
- 29% reduction in 7-day prevalence of diarrhea
- 25% reduction in acute respiratory infections
- 97.5% reduction in fecal contamination of drinking water
- 38% reduction in cryptosporidium seroconversion
Air Quality — A Cautionary Finding
- Personal PM2.5 exposure remained unchanged despite improved cookstoves
- Stove stacking: traditional fire use increased from 24% to 49% over study period
The Adherence Problem
- Self-reported filter use: 67%
- Sensor-detected filter use: 37%
- Self-reported stove use: 84%
- Sensor-detected stove use: 37%
- Reported use declined: 75% → 68% → 65% across survey rounds
Economics
- 5-year programme cost: ~$12 million
- Estimated 5-year benefit: >$66 million
- Fuelwood savings: 65,000 tons — enough to reverse regional deforestation
Sources: Kirby, Nagel et al. (2019) PLoS Medicine; Thomas et al. (2018) Lancet Planetary Health; Thomas (2019) The Conversation
Technology & Digital Monitoring
Water Filters
- LifeStraw Family 2.0 household water filters
- Significant microbiological effectiveness reducing E. coli contamination
- Free distribution with carbon waiver for credit generation
Remote Sensing Innovation
- Electronic sensors remotely transmitting usage data
- Sensor-reported use was substantially lower than self-reported use
- Demonstrated critical value of objective digital monitoring
- Published in ACS Environmental Science & Technology
Carbon Credit Model
- Pay-for-performance model funded by voluntary carbon credits
- Health, livelihood, and environmental benefits substantially outweighed costs
- Fuel savings and averted healthcare costs = largest economic gains
& Service Interval


In 2007, I started a company to get water treatment to families who relied on untreated water in Rwanda and Kenya. We were the first company to register with the United Nations to earn carbon credits for treating drinking water anywhere in the world. Some people boil their water; most people just drink dirty water. We earned carbon credits — and therefore revenue — by reducing demand for firewood used to boil water. That revenue paid for the water service on an ongoing basis and repaid investors.
These programs have so far reached over five million people with clean water, and mobilized private and public sector investments from venture capital, carbon credit buyers, NASA, and USAID of over $70 million, while generating over $100 million in returns for investors and as investment in communities. People are getting clean water in places where governments and donors aren't able to reach.

Forecasting Groundwater Demand from Space
69 IoT sensors + satellite data + 19-algorithm ML ensemble — Kenya ASALs. Science of the Total Environment 831 (2022) 154453.
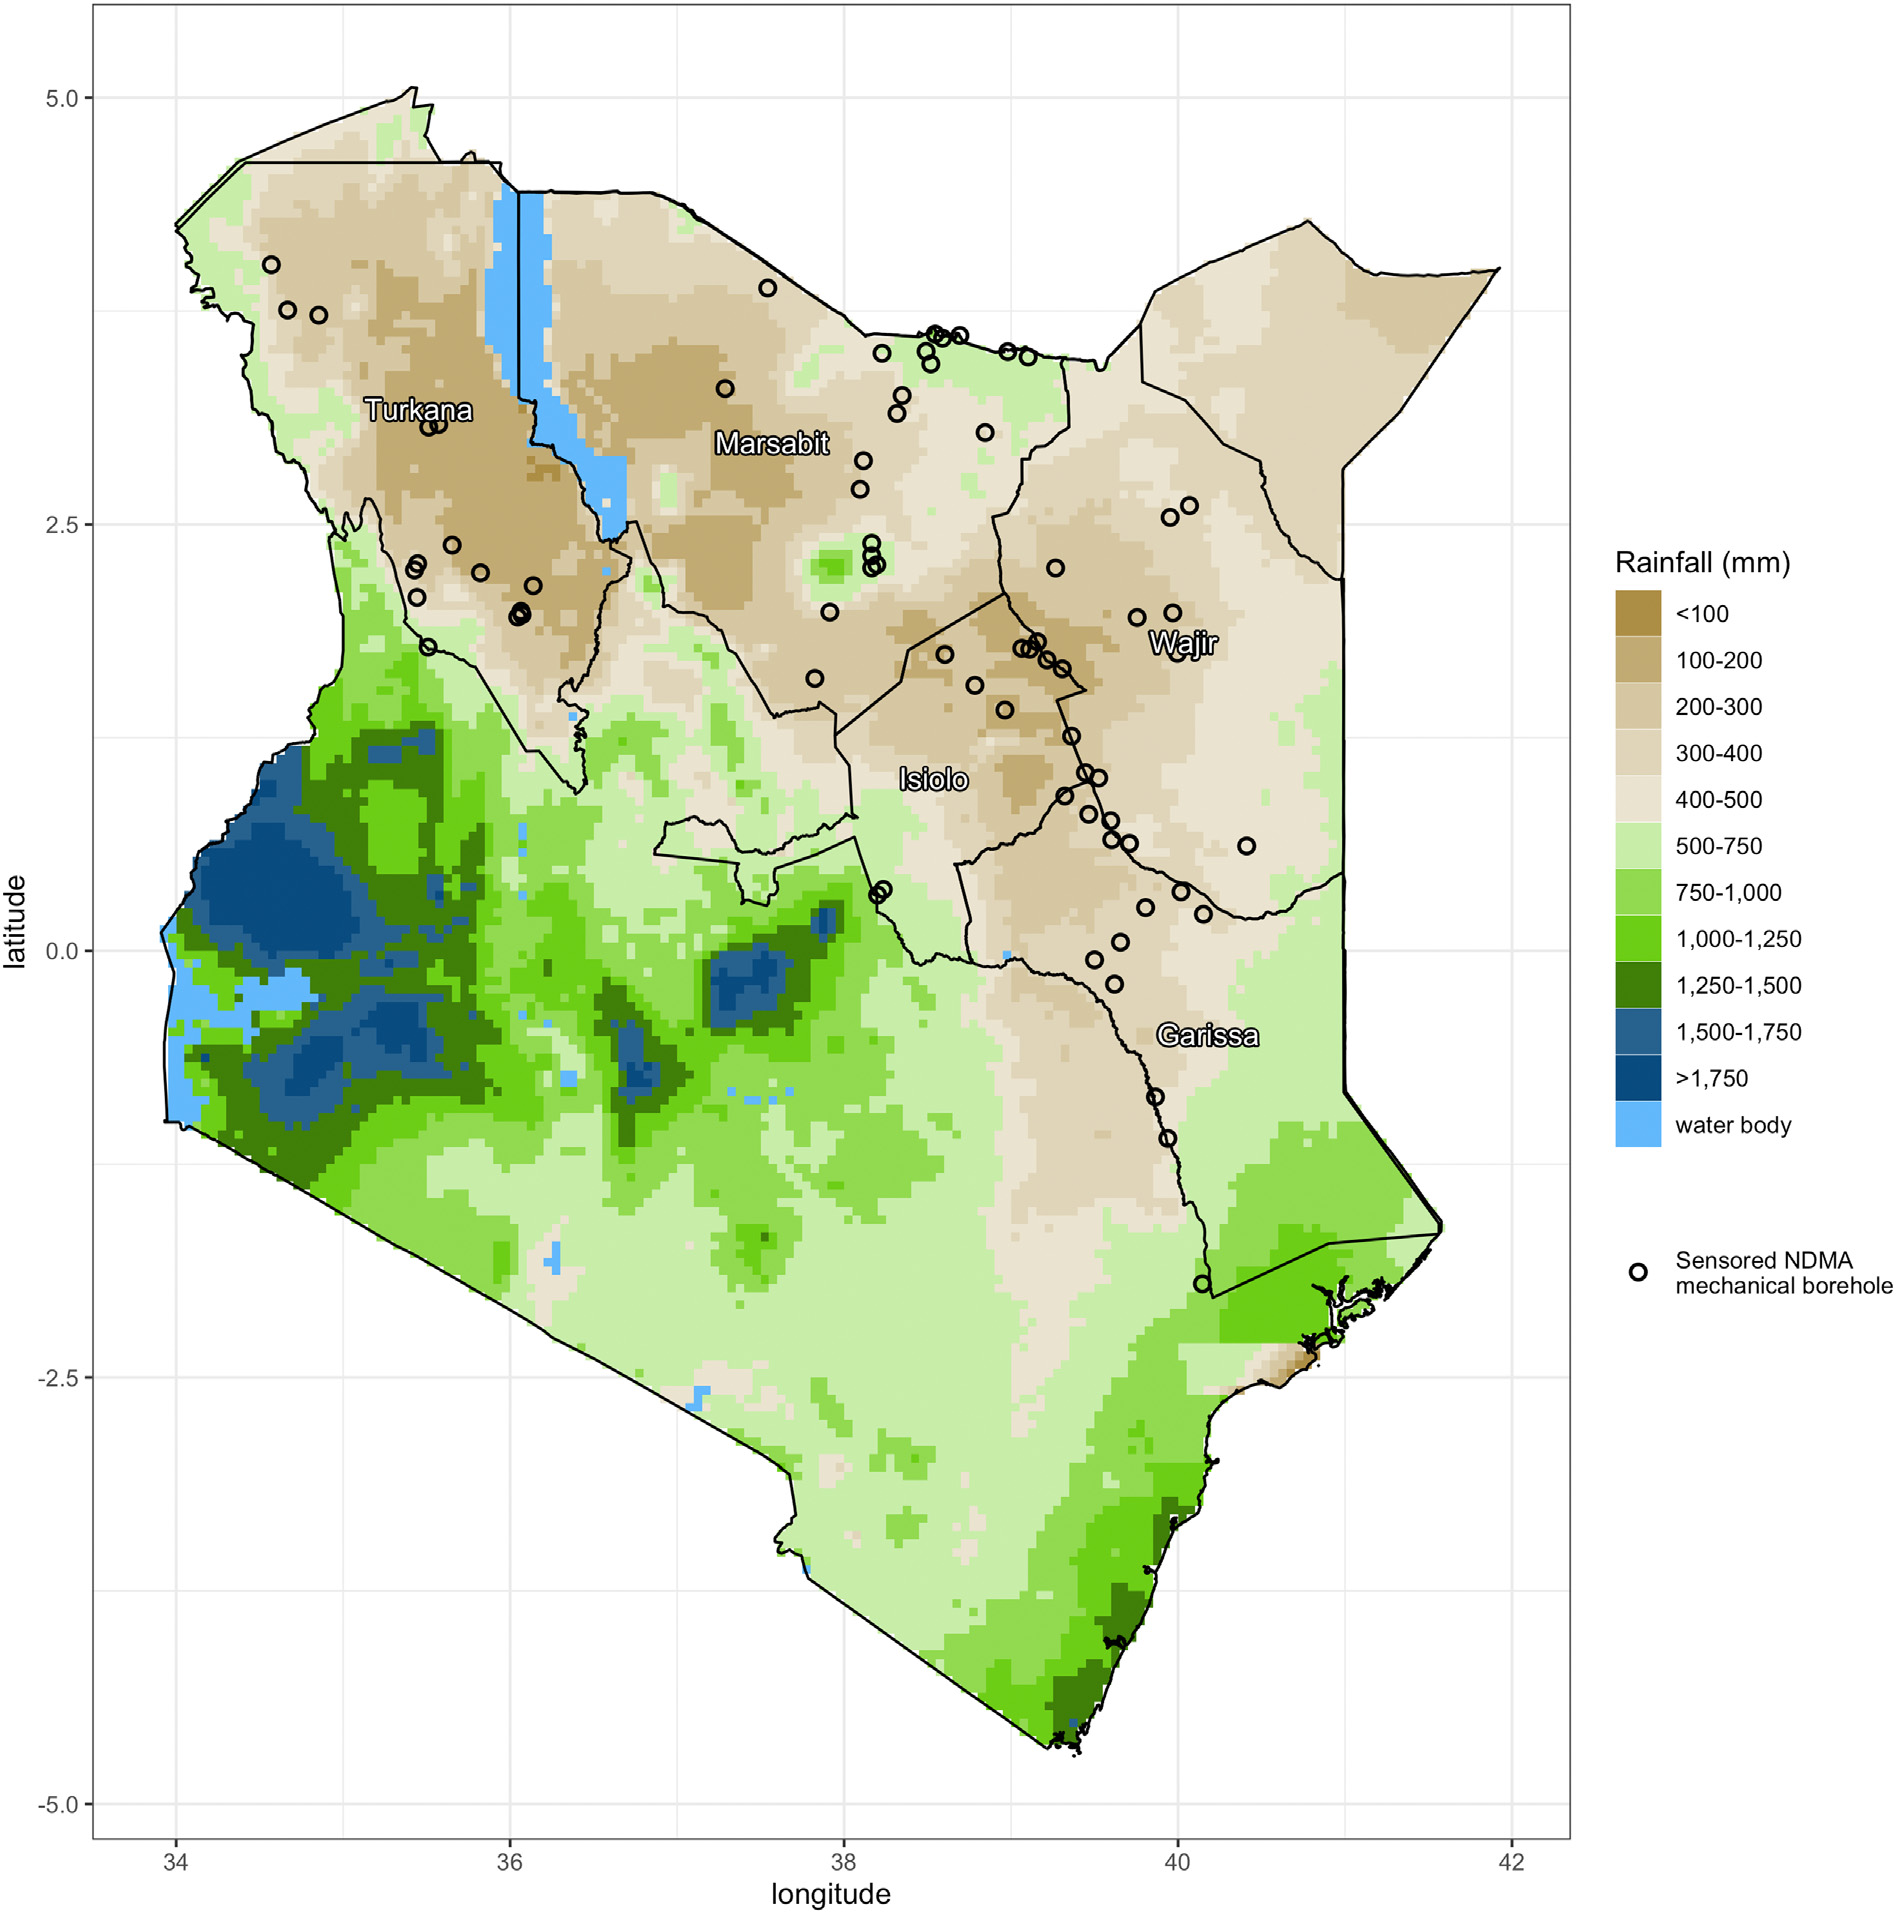
Fig. 1 — 69 sensored NDMA boreholes (open circles) across 5 ASAL counties, 260,000 km². Mean annual CHIRPS rainfall shown.
Predicted probability of high demand (>75 L/p/d) — Jun–Sep 2021
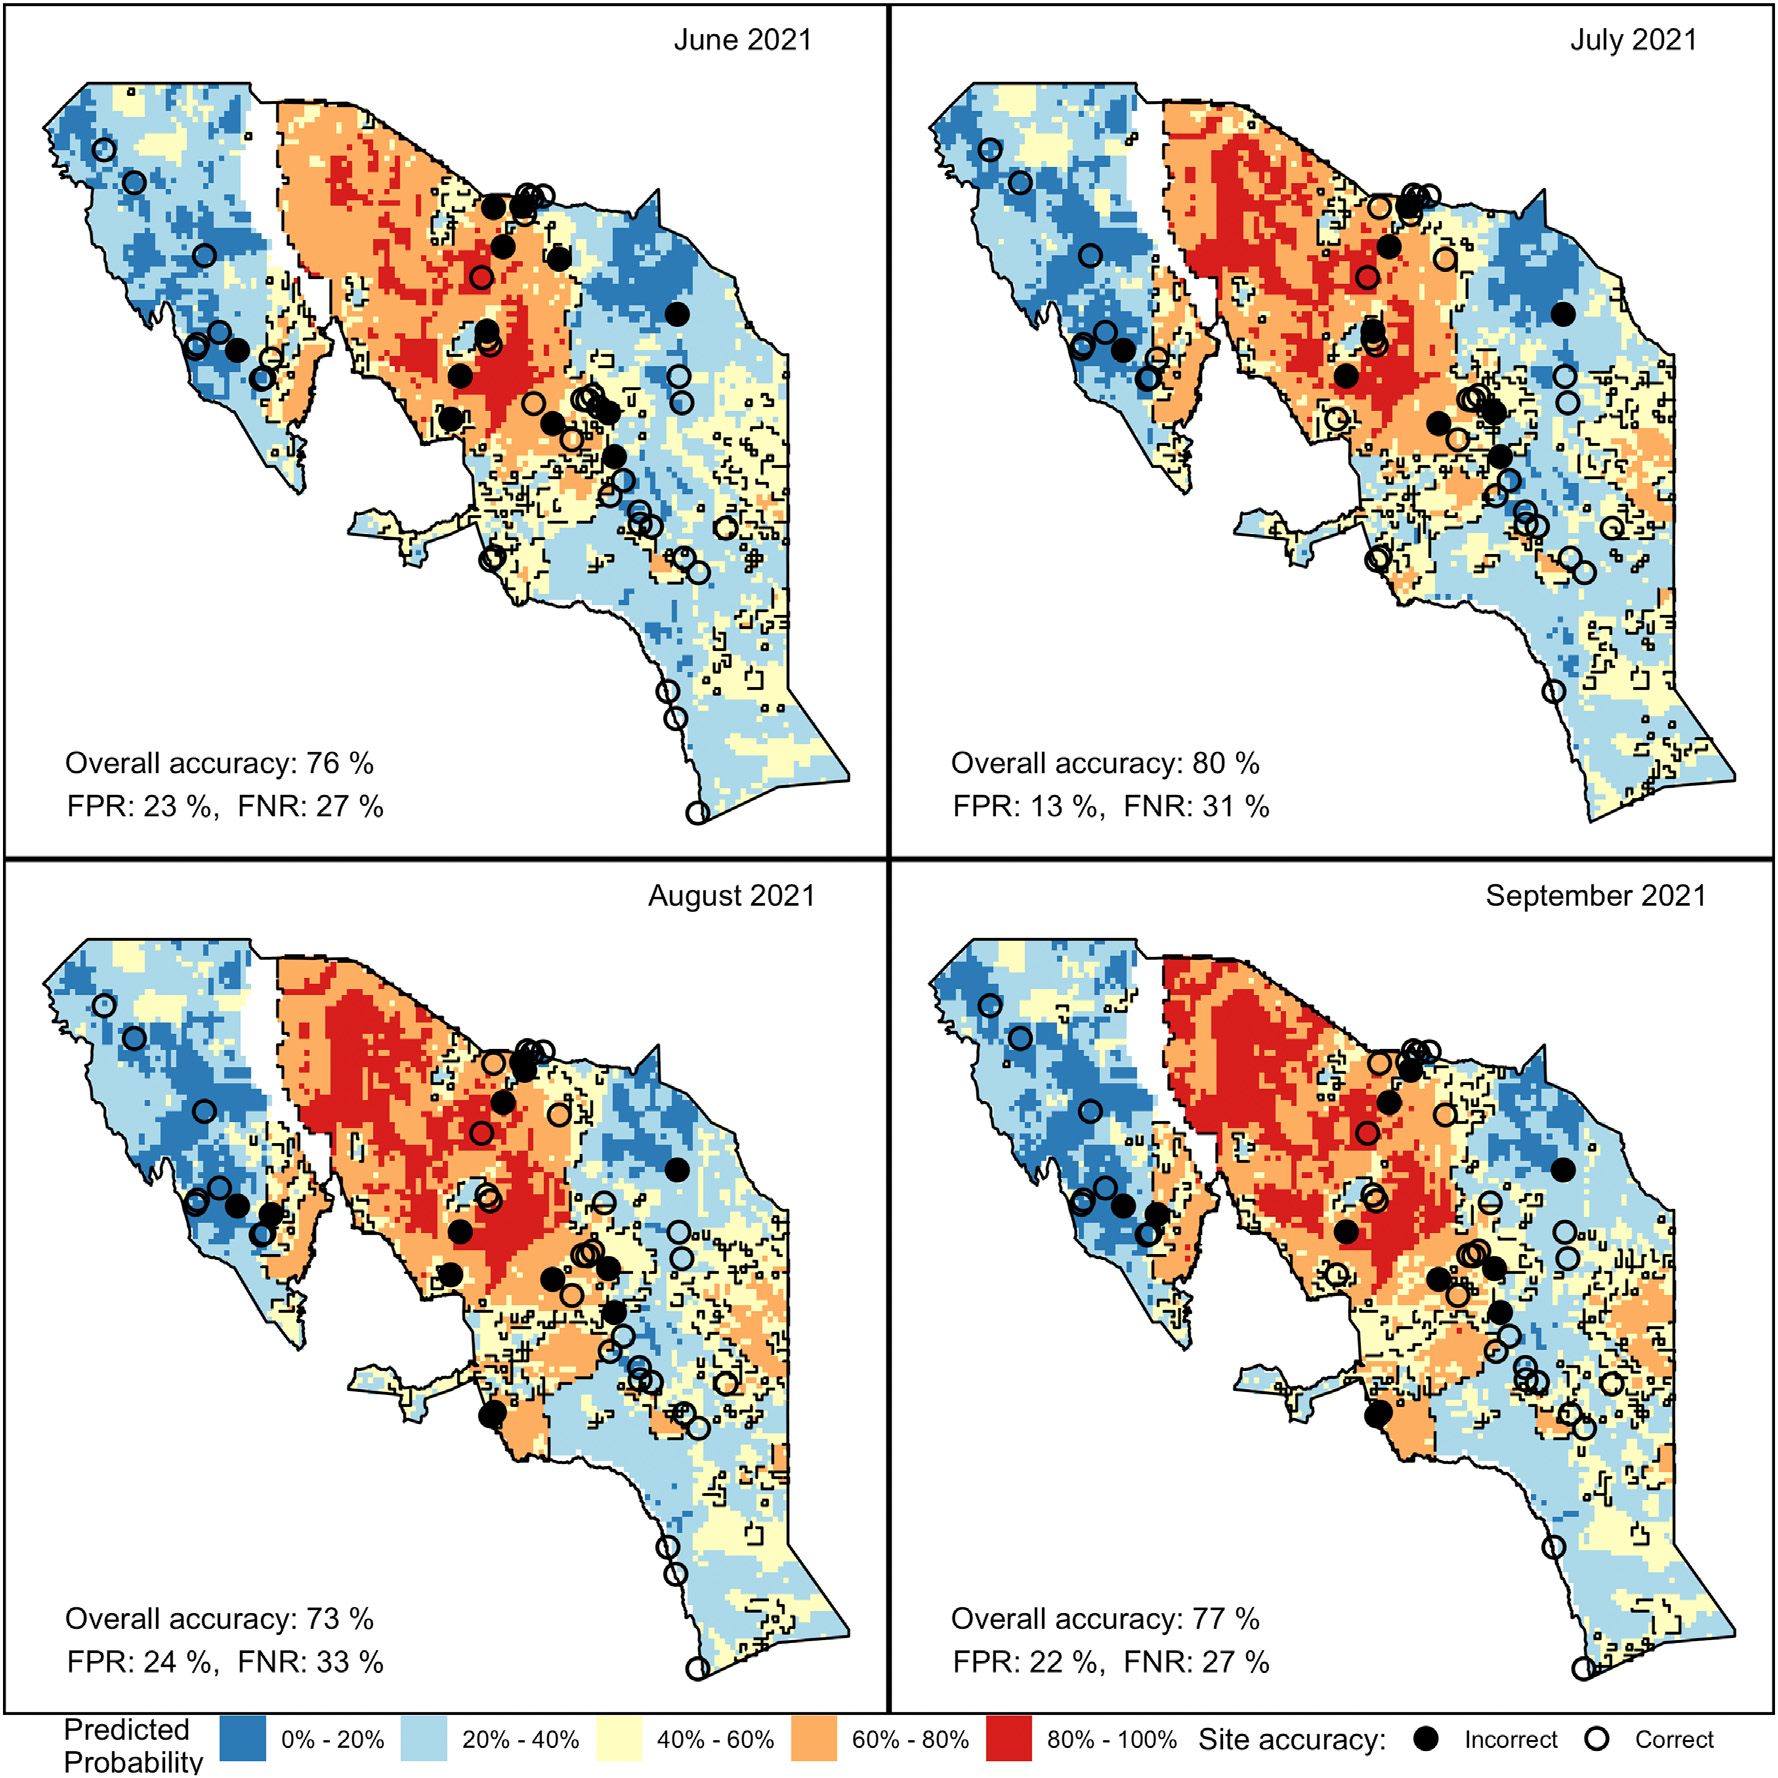
Fig. 3 — Red = high probability of demand exceeding 75 L/p/d; white/pale = low probability. Open circles = correct predictions; filled = incorrect. Overall accuracy 73–80%. Now adopted by FEWS NET & Kenya NDMA for drought early action.
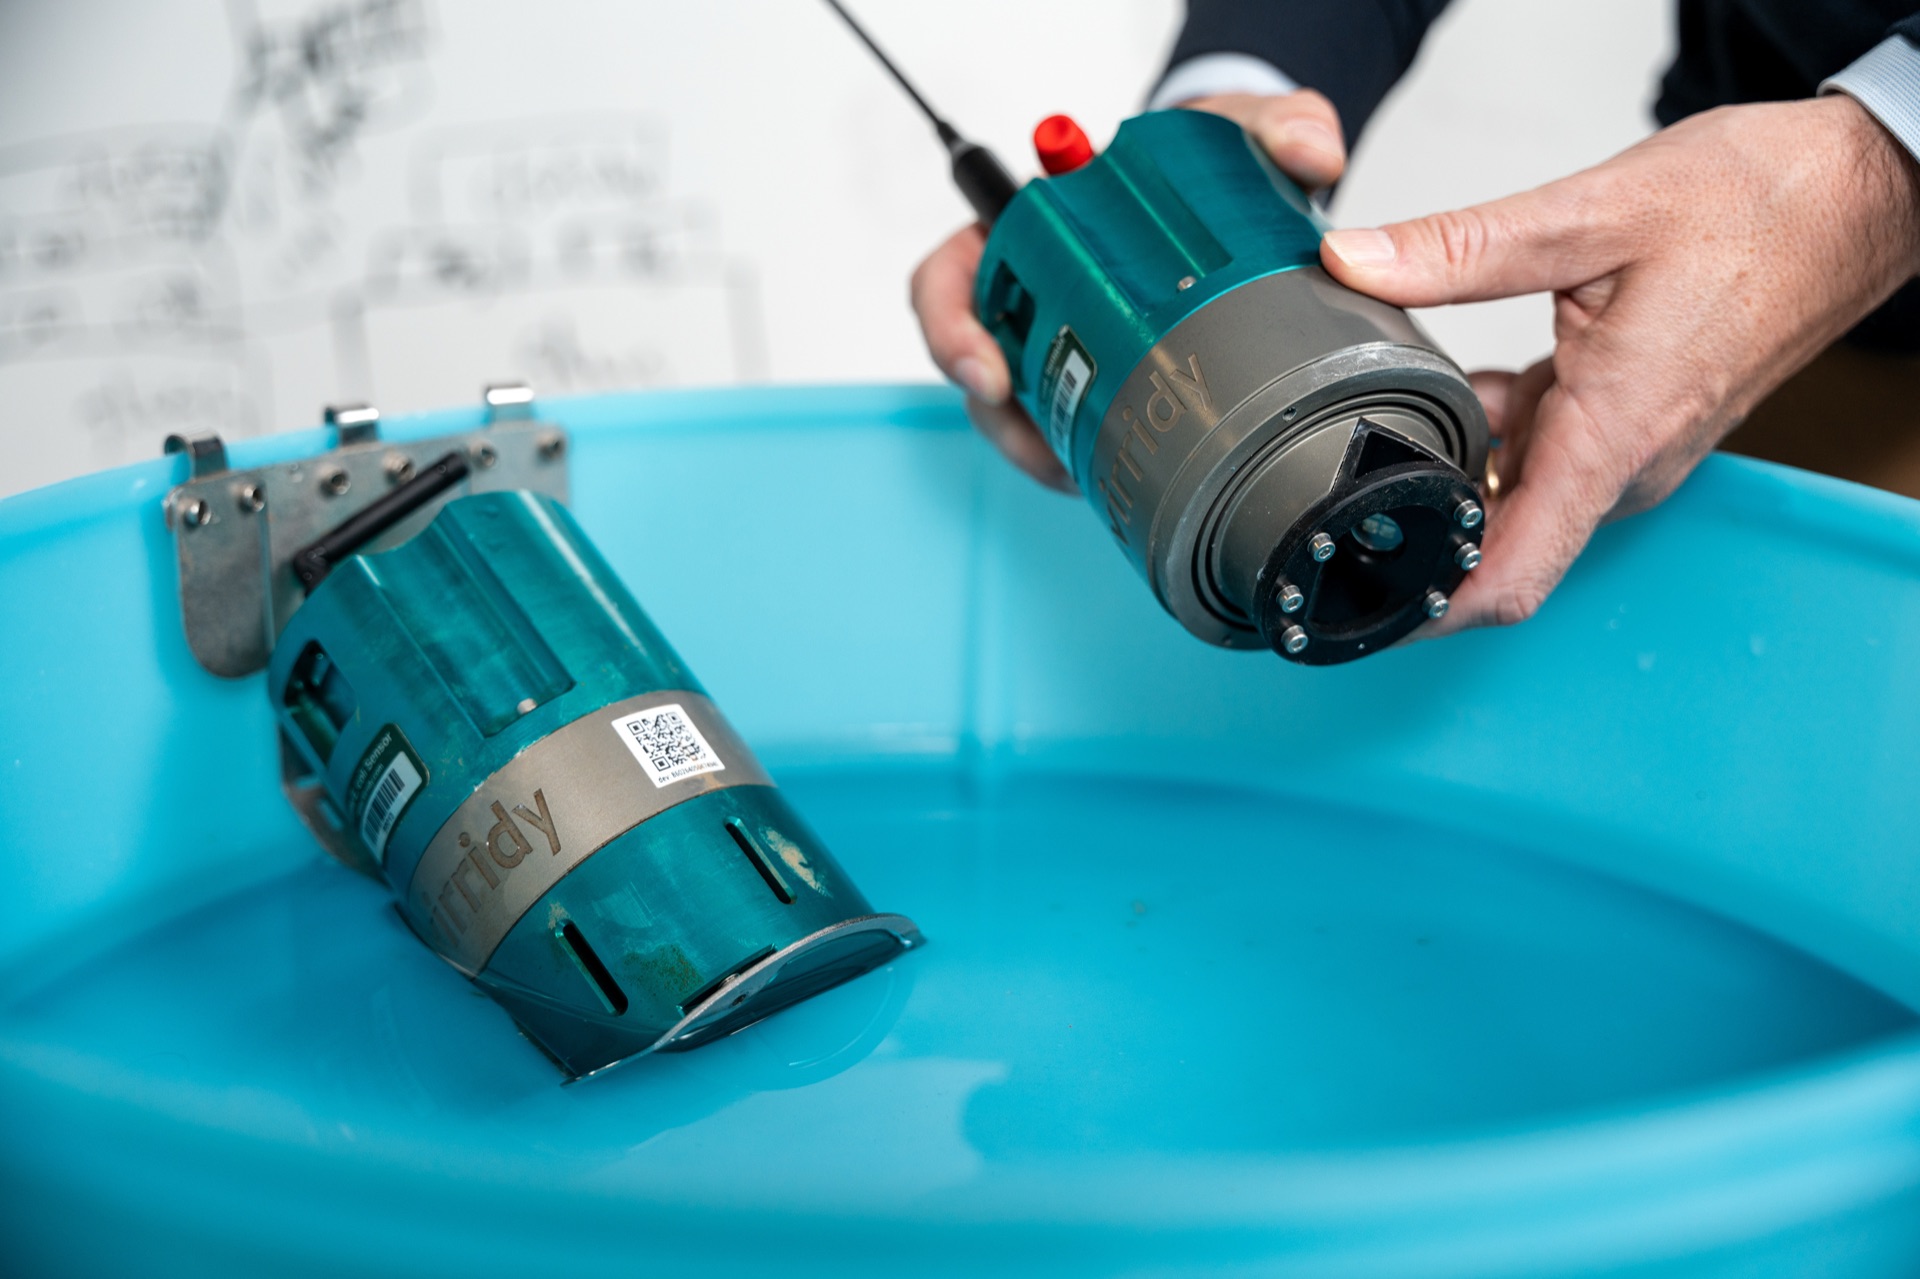
The Lume Sensor
in the field.
Two decades of field research in low-income settings, now embedded in a commercial product. How continuous monitoring transforms the accountability loop into a sustainable business.
Global Water Security Solutions
Lume Sensors
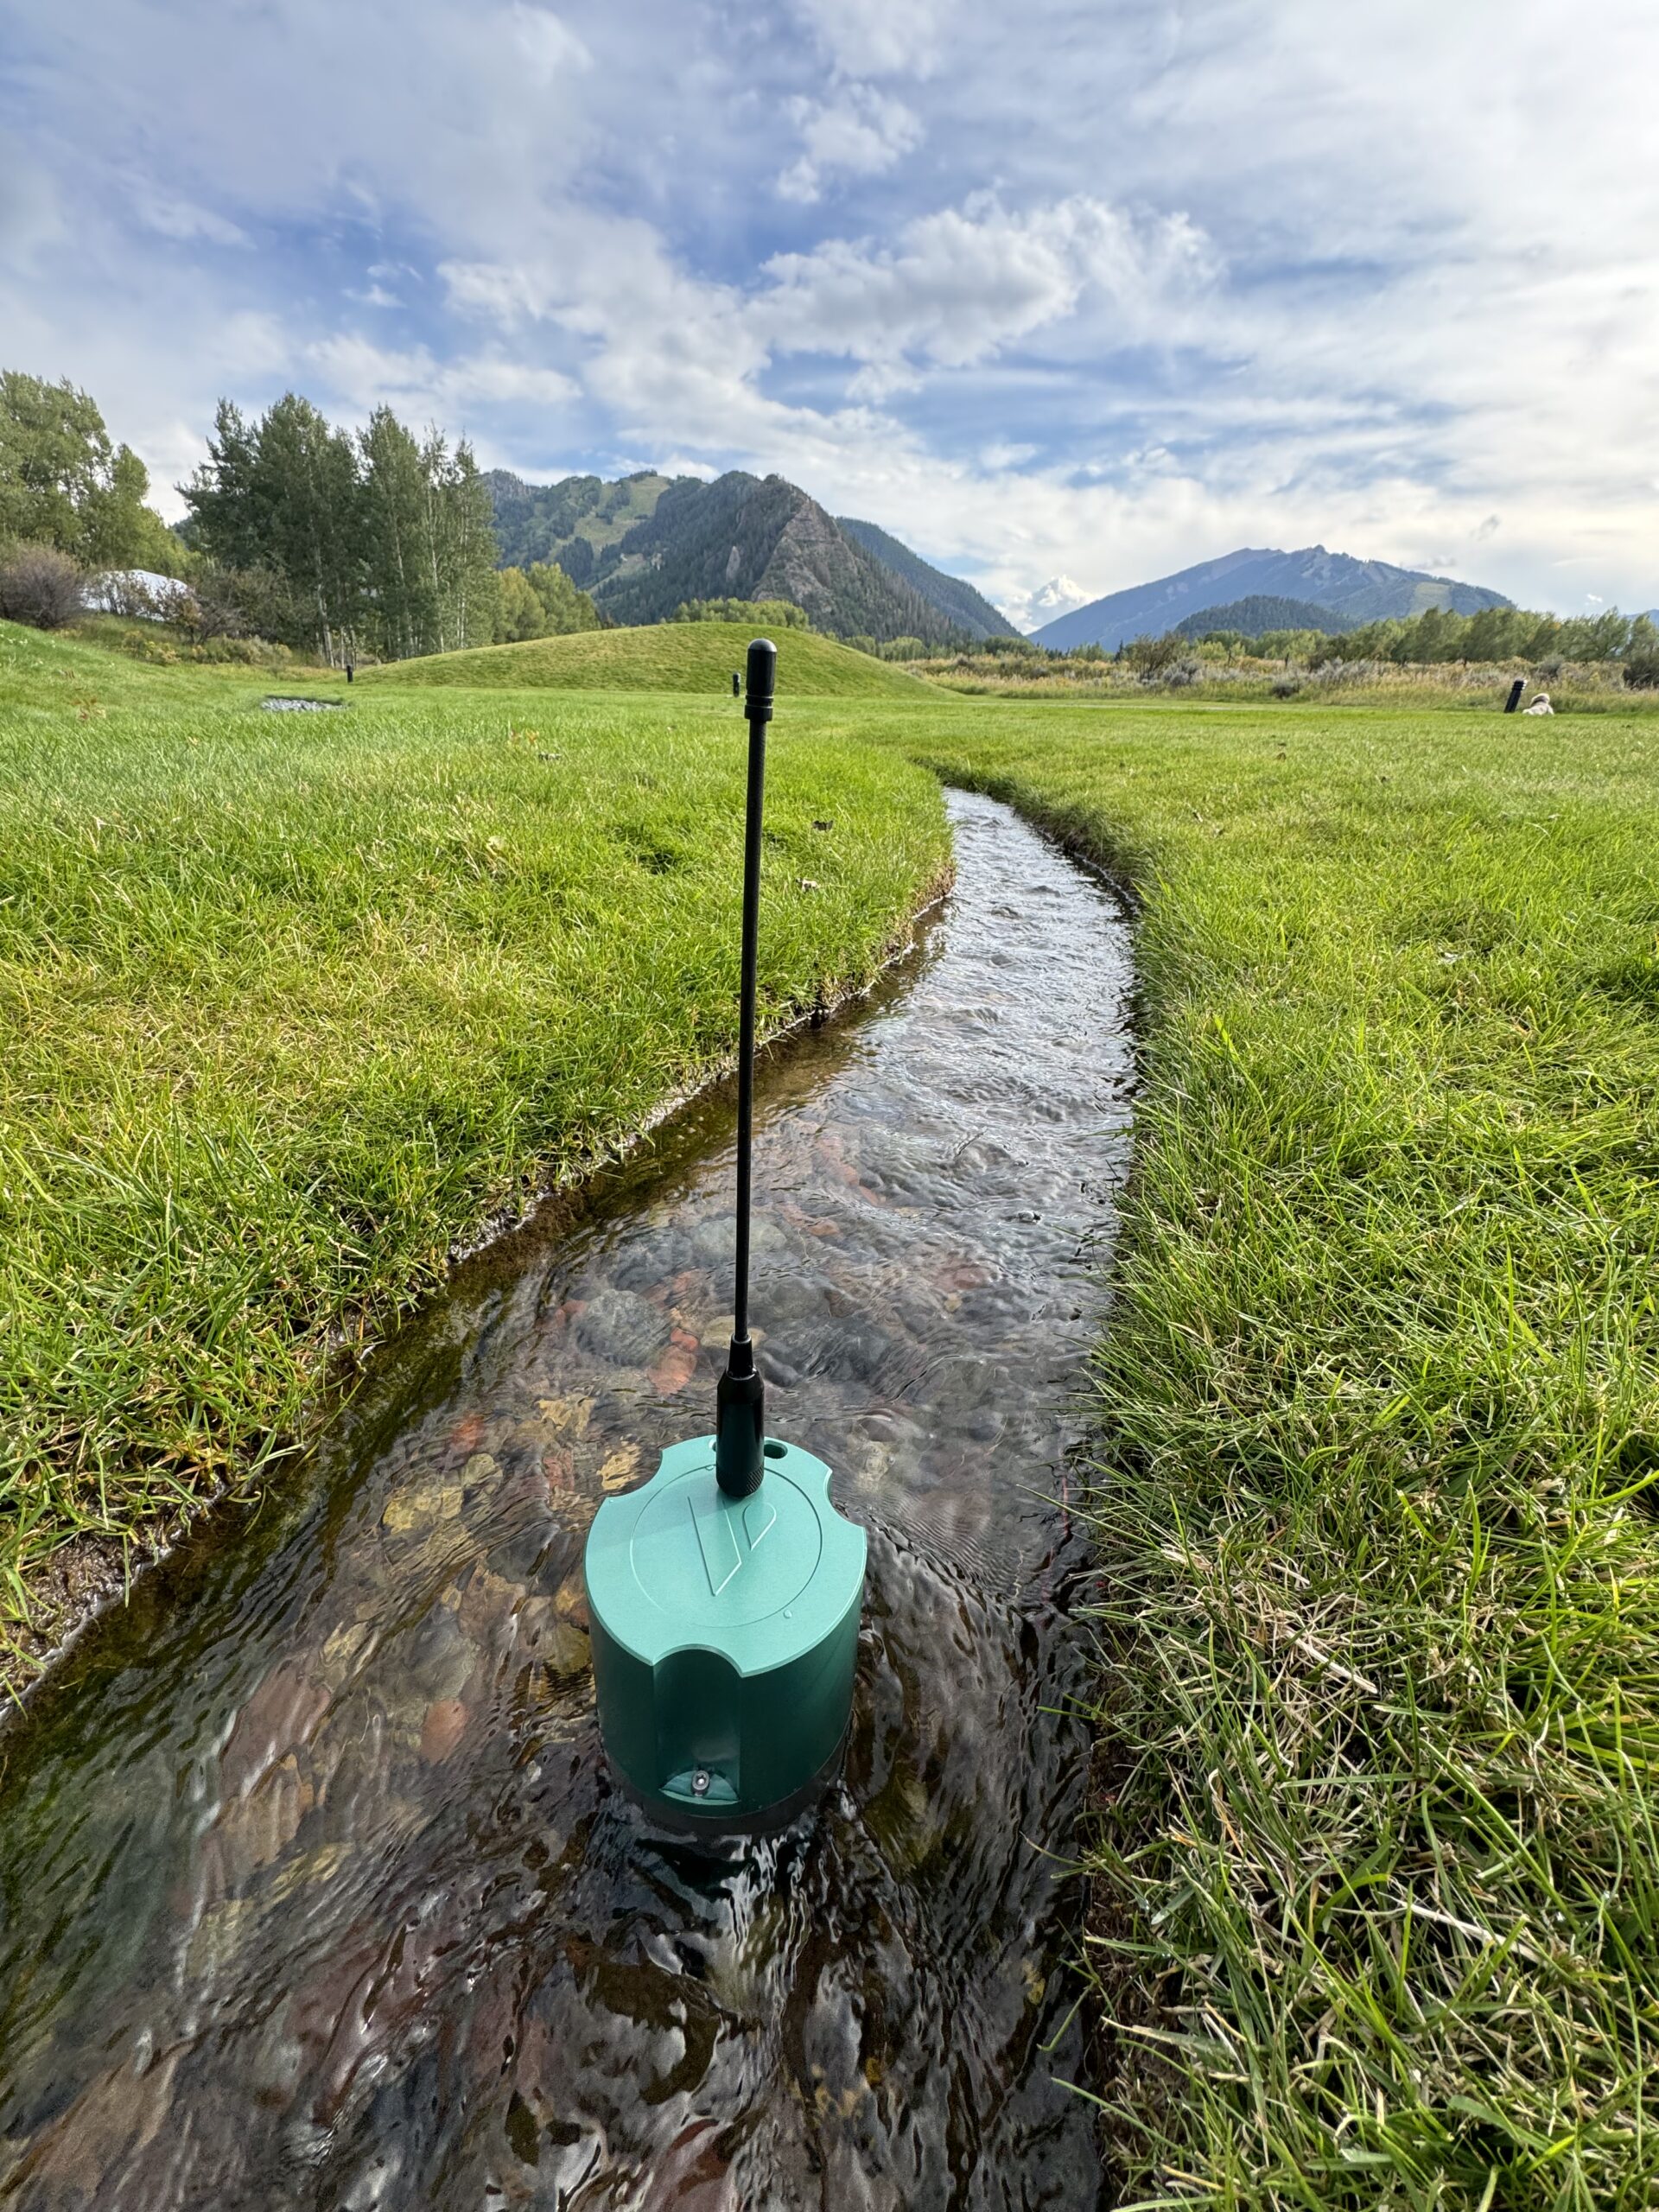
Three optical modes — TLF (E. coli), Chlorophyll-a (algae), FDOM (organics). 75%+ accuracy, >94% categorical. 1-year battery life.
Water for Carbon
Drinking water treatment, precision irrigation, and watershed restoration. Gold Standard, Verra & Regen certified. 29-49% diarrhea reduction.
Global Portfolio
10 active projects across 12 countries. IoT-verified impact — no self-reporting. 5.6x cost-benefit ratio across health, livelihood, and environment.

Meet the Lume
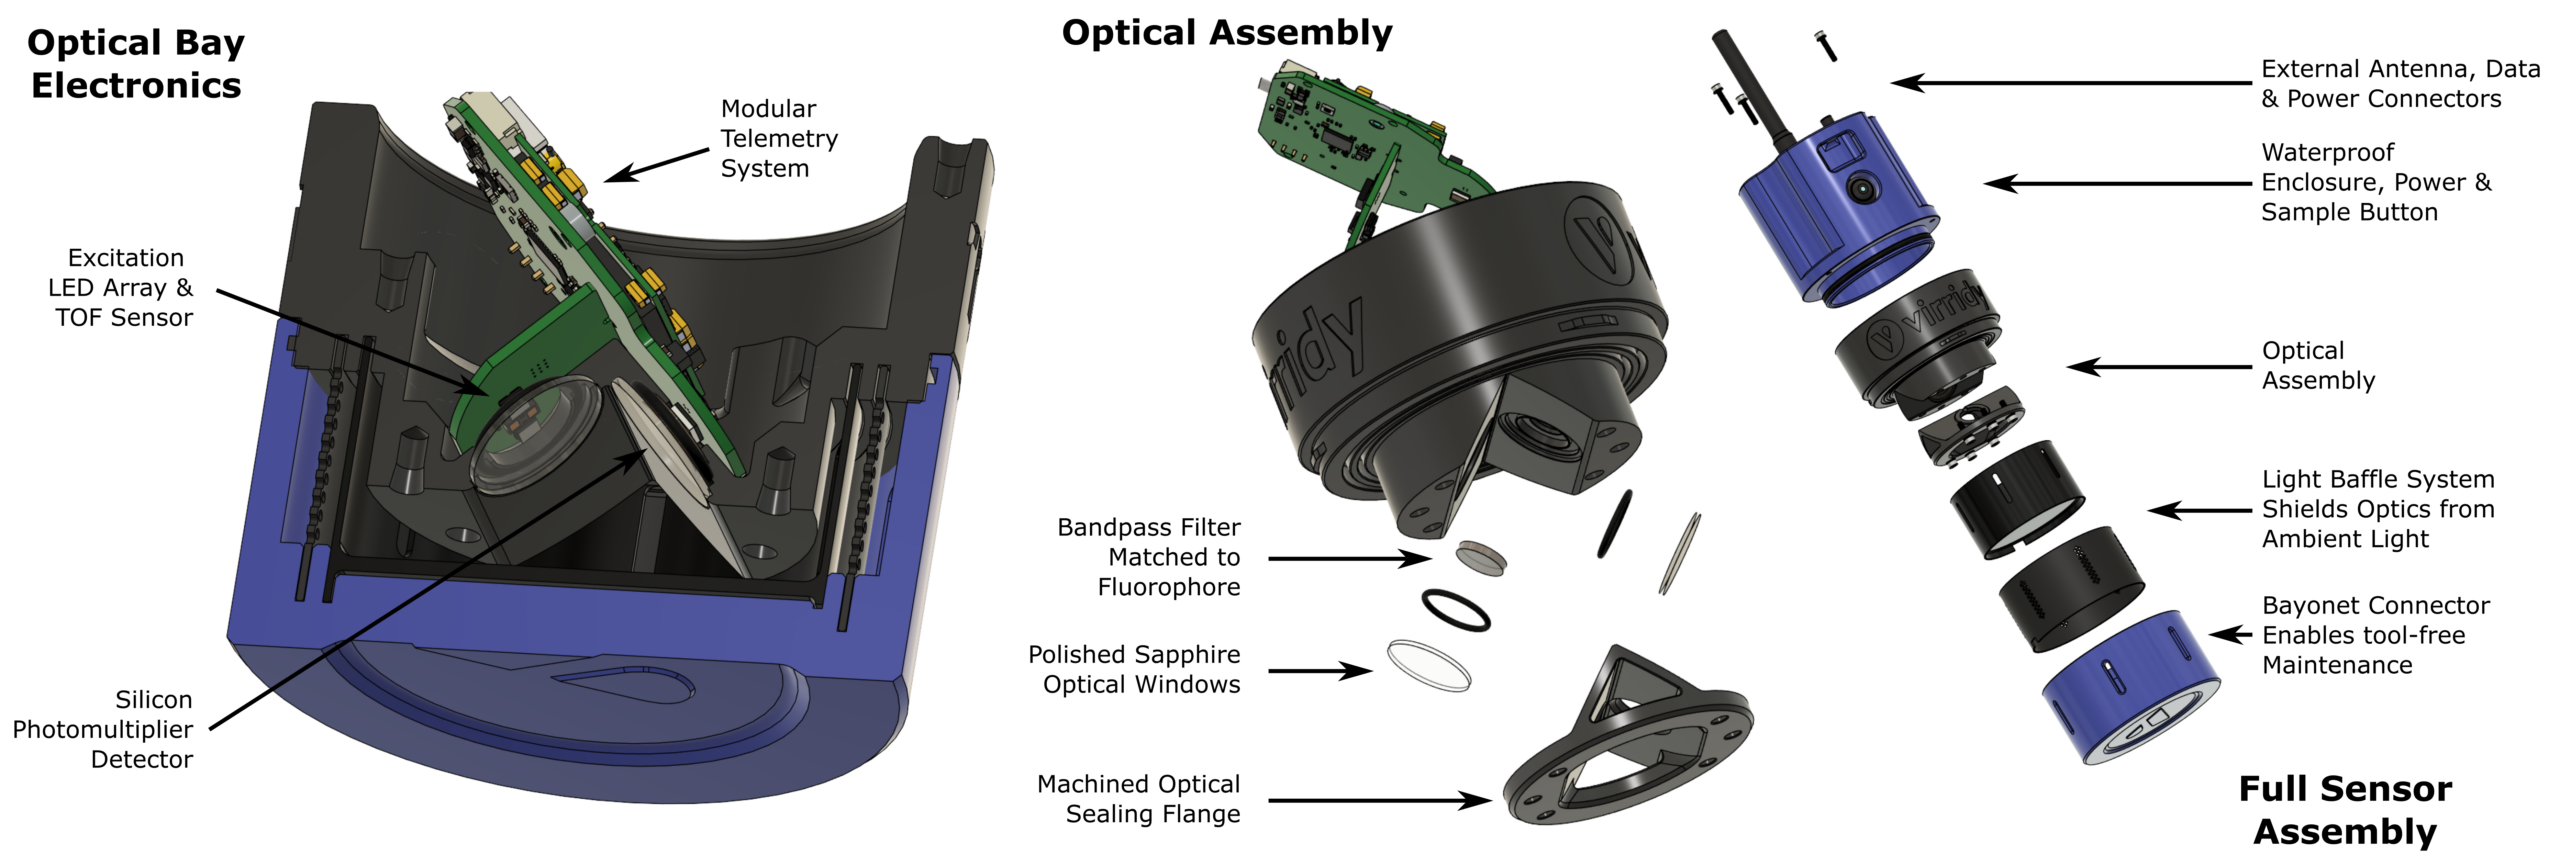
The first continuous, field-deployable E. coli proxy sensor — built on deep-UV fluorescence and on-device machine learning.
- Deep-UV optical excitation at 280 nm targets tryptophan-like fluorescence — a direct proxy for fecal bacteria, not a surrogate of a surrogate
- Three interchangeable modes: TLF (E. coli), Cl-A (algae/HABs), FDOM (dissolved organics) — same hardware, swapped optics
- On-device ML anomaly detection learns site-specific baselines and flags contamination without fixed thresholds — US Patent 11,506,606 B2
- 91–92% classification accuracy at regulatory thresholds; Cohen’s κ = 0.82–0.84 against Colilert reference method
- No calibration required — optical design and ML together eliminate the drift-correction burden that has blocked continuous WQ sensing for decades
Bedell, Fankhauser, Sharpe, Wilson & Thomas — CU Boulder / Virridy
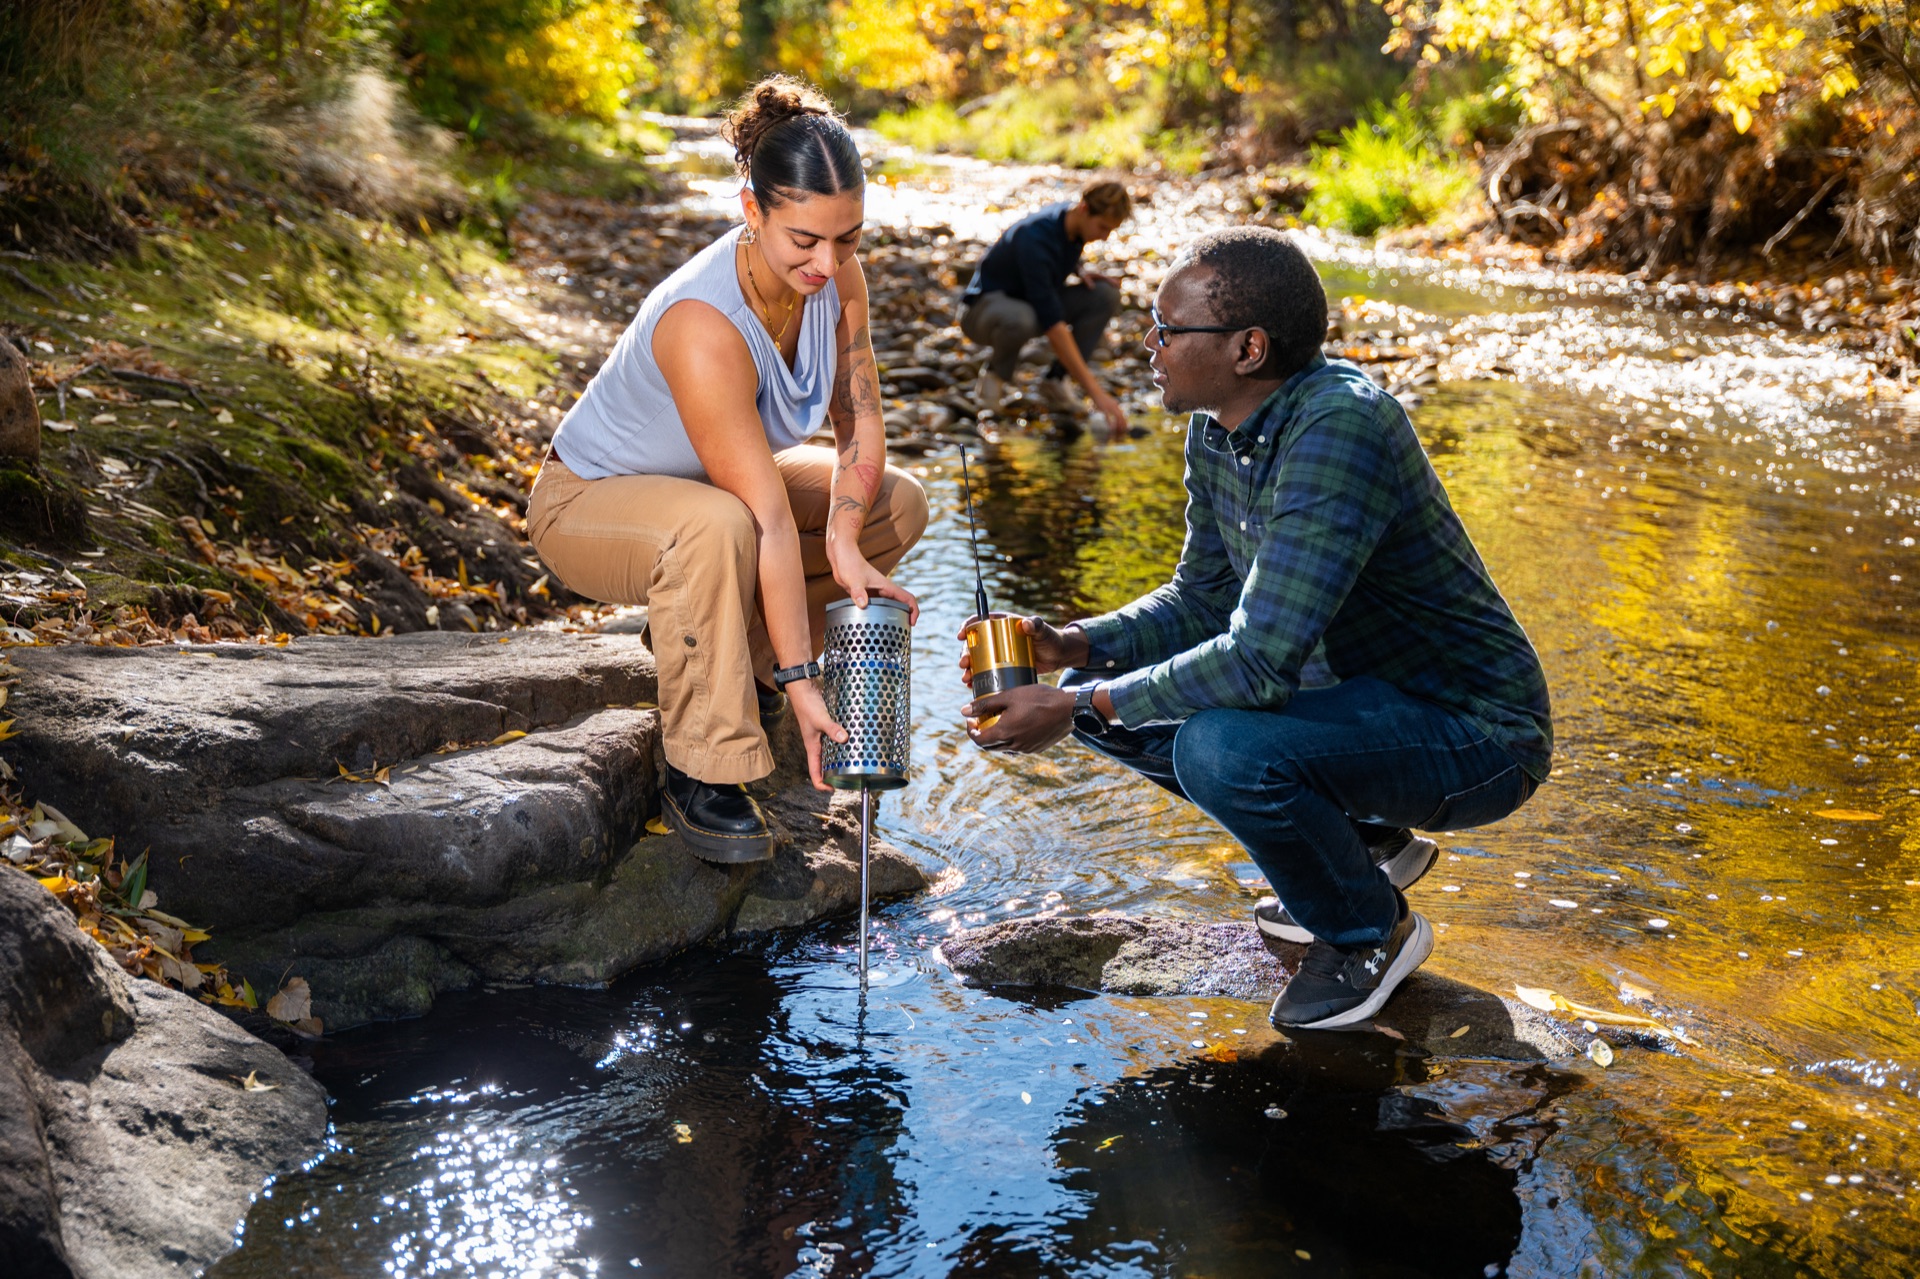
Field Testing the Lume
Researchers deploying the Lume sensor in natural stream environments for real-time E. coli monitoring and validation studies.
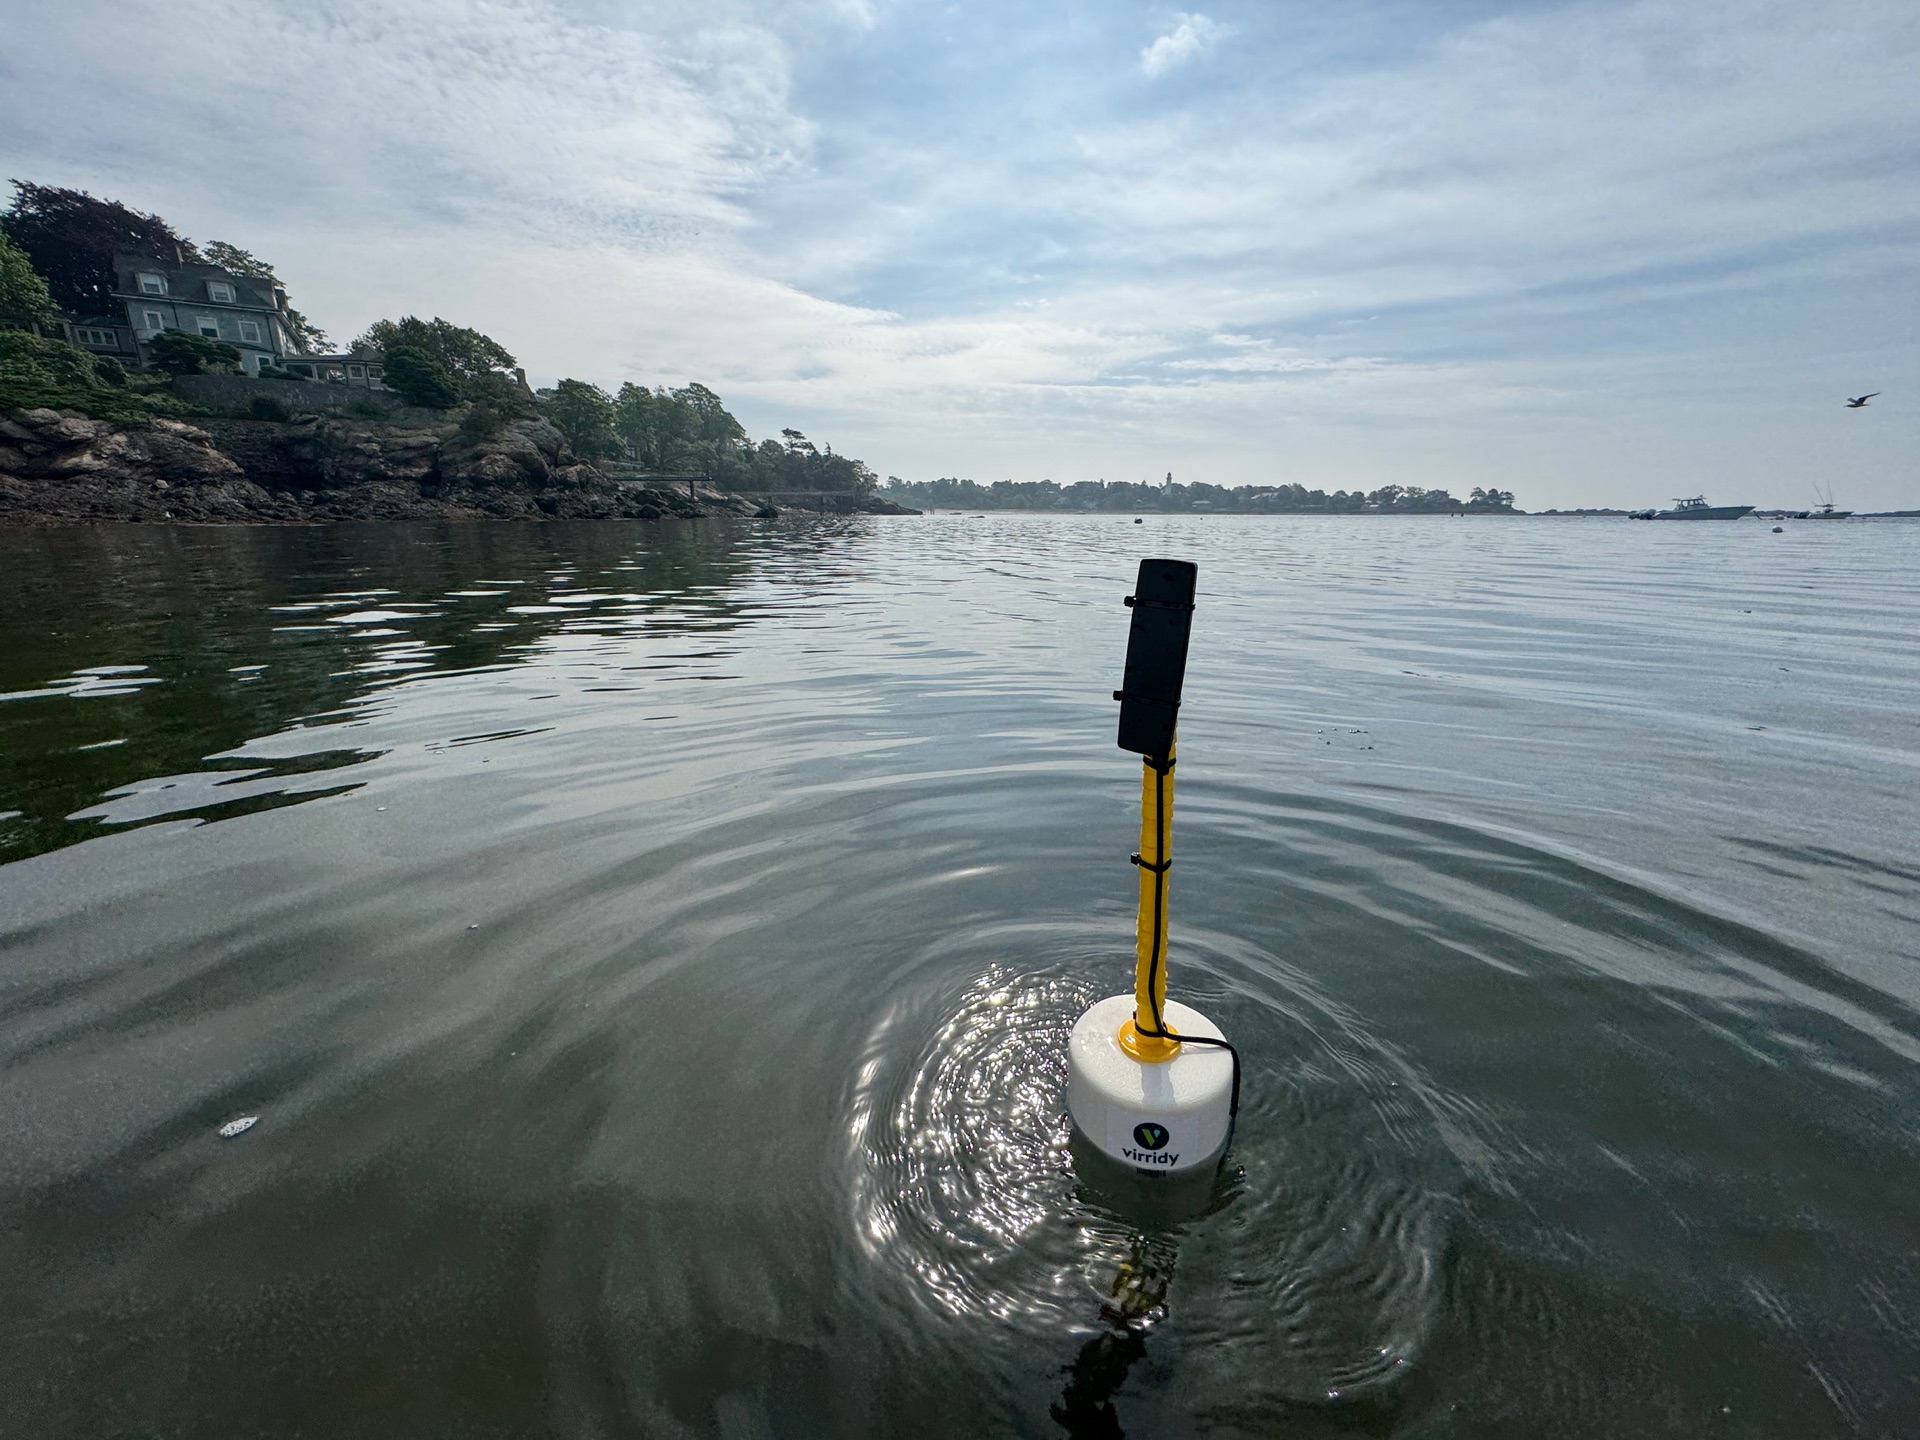
Seine River, Paris
Virridy’s Lume sensors monitoring water quality for recreational swimming safety along the Seine River.
Hardware & Analytics
Sensor Capabilities
- TLF: E. coli & microbial contamination (280/350 nm)
- Cl-A: algal biomass & bloom detection (470/680 nm)
- FDOM: dissolved organics & nutrient loading (365/480 nm)
- Integrated turbidity, temperature, GPS
- No regular calibration or cleaning required
Operations
- Sampling: 30 sec to 24 hours (remote config)
- Battery: up to 1 year; solar or wall charging
- Cellular & satellite connectivity
- Single integrated unit — no external power or telemetry
- ML quantification with protected dashboard & API
Economics
- $200/month vs. competitors at $5K–$30K
- 700+ data points/month/site
- Hand-removable cover for tool-free field maintenance
- Captures transient contamination events that weekly sampling misses
Analytical Features
Adaptive Contamination Detection
The Lume uses machine learning to learn normal conditions and trigger contamination alerts based on learned patterns rather than fixed thresholds.
US Patent 11,506,606 B2 — Bedell, Fankhauser, Sharpe, Wilson & Thomas
Automated System-State Classification
Time-series data from water infrastructure sensors are analyzed to classify system states and support operational decisions without manual inspection or rule-based logic.
US Patent 11,507,861 B2 — Wilson, Coyle, Thomas & Croshere
Natural Waters Application
Gradient-boosted decision tree models achieving 75%+ accuracy across 0–1,000 CFU/100mL, >94% categorical accuracy with site calibration, and 7% MAPE (log-transformed).
Drinking Water Classification
The Lume has been validated for drinking water monitoring across chlorinated and unchlorinated supplies. Binary classification at regulatory thresholds of 1 and 10 CFU/100 mL yields 91–92% overall accuracy with Cohen's kappa of 0.82–0.84.
Confusion matrices for binary classification of water quality using sensor predictions versus laboratory-observed E. coli concentrations at two regulatory thresholds.
Chlorinated Supply Monitoring
The Lume detects chlorine residual presence in treated water supplies with 85% accuracy, distinguishing pre- and post-chlorinated samples.
Left: Predicted vs observed E. coli on log axes. Right: Binary classification of chlorine residual presence (accuracy 0.85, kappa 0.70).
Natural Waters — Local Model
The Lume algorithm has been extensively validated against Colilert E. coli in freshwater systems. Over 75% of predictions fall within the analytical uncertainty bounds of the Colilert reference method, with 7% MAPE in log-transformed space.
Left: Boulder Creek test dataset. Right: Categorical classification into three management-relevant bins (<10, 10–100, >100 MPN/100 mL). Balanced accuracy 95%, Cohen's kappa 0.84.
Natural Waters — Global Model
Temporally structured cross-validation across the global dataset. RMSE ranged from 0.55 (training) to 0.63 log units (test), with MAPE below 22% across both splits.
Left: Global dataset cross-validation. Right: Seine River, Paris — binary classification achieving 96.8% accuracy and 94% balanced accuracy using three TLF sensors.
Lume Development
Hardware Engineering
Internal and contracted expertise in IoT, signals, embedded systems, hardware design.
Analytical Science
Internal and contracted expertise in watershed AI/ML and front-end product development.
Manufacturing
Contract manufacturer established in China. 200 units produced, 60 sold as of March 2026.
Distribution
Internal through 2026; contracted thereafter.
Sales & Applications
Extensive internal sales and research expertise.
Risk Management
Lume 1.1 traction will support positive margin on COGS in 2026 before further NRE investment.
Microbial Sensor Global Market
Global water quality sensor market in 2024, projected to reach $12.9B by 2033 (CAGR ~9%).
Cl-A sensors sold in US in past 10 years. Annual market ~$100M. Microbial is the next frontier.
| Sensor | Description | Setup | Est. Cost | Accuracy |
|---|---|---|---|---|
| Virridy Lume | Tryptophan sensor; ML model analysis | Single, fully integrated IoT sensor | $200/month/site | 75%+ accuracy, >94% categorical |
| Proteus Sonde | Multiparameter sonde | Requires data logger, site-specific calibration | $14K - $24K+ | +/- 10 CFU/100mL |
| Chelsea UViLux | Tryptophan, CDOM, BTEX, BOD | Not specified | ~$5,000 | 0.01 QSU sensitivity |
| YSI (Xylem) | Chlorophyll only, no tryptophan | Multiparameter sonde | $4,985+ | N/A for TLF |
| In Situ Inc. | FDOM, CDOM, Cl-A, no tryptophan | Multiparameter sonde + telemetry | ~$10,000 | N/A for TLF |
Pricing Strategy
Competition sells for $5K - $30K one-time hardware cost. Virridy focuses on recurring revenue.
- $557K Lume revenue YTD March 2026 (target exceeded); targeting $1M+ for full year
- Target 50%+ margin on COGS
- Convert from one-time sales to recurring subscriptions in 2026
- Minimum 10+ units, 12-month contract
- Includes: device lease, connectivity, cloud dashboard, API, fleet monitoring, firmware updates, onboarding support
Key Figures
12-month minimum contract = 2x COGS
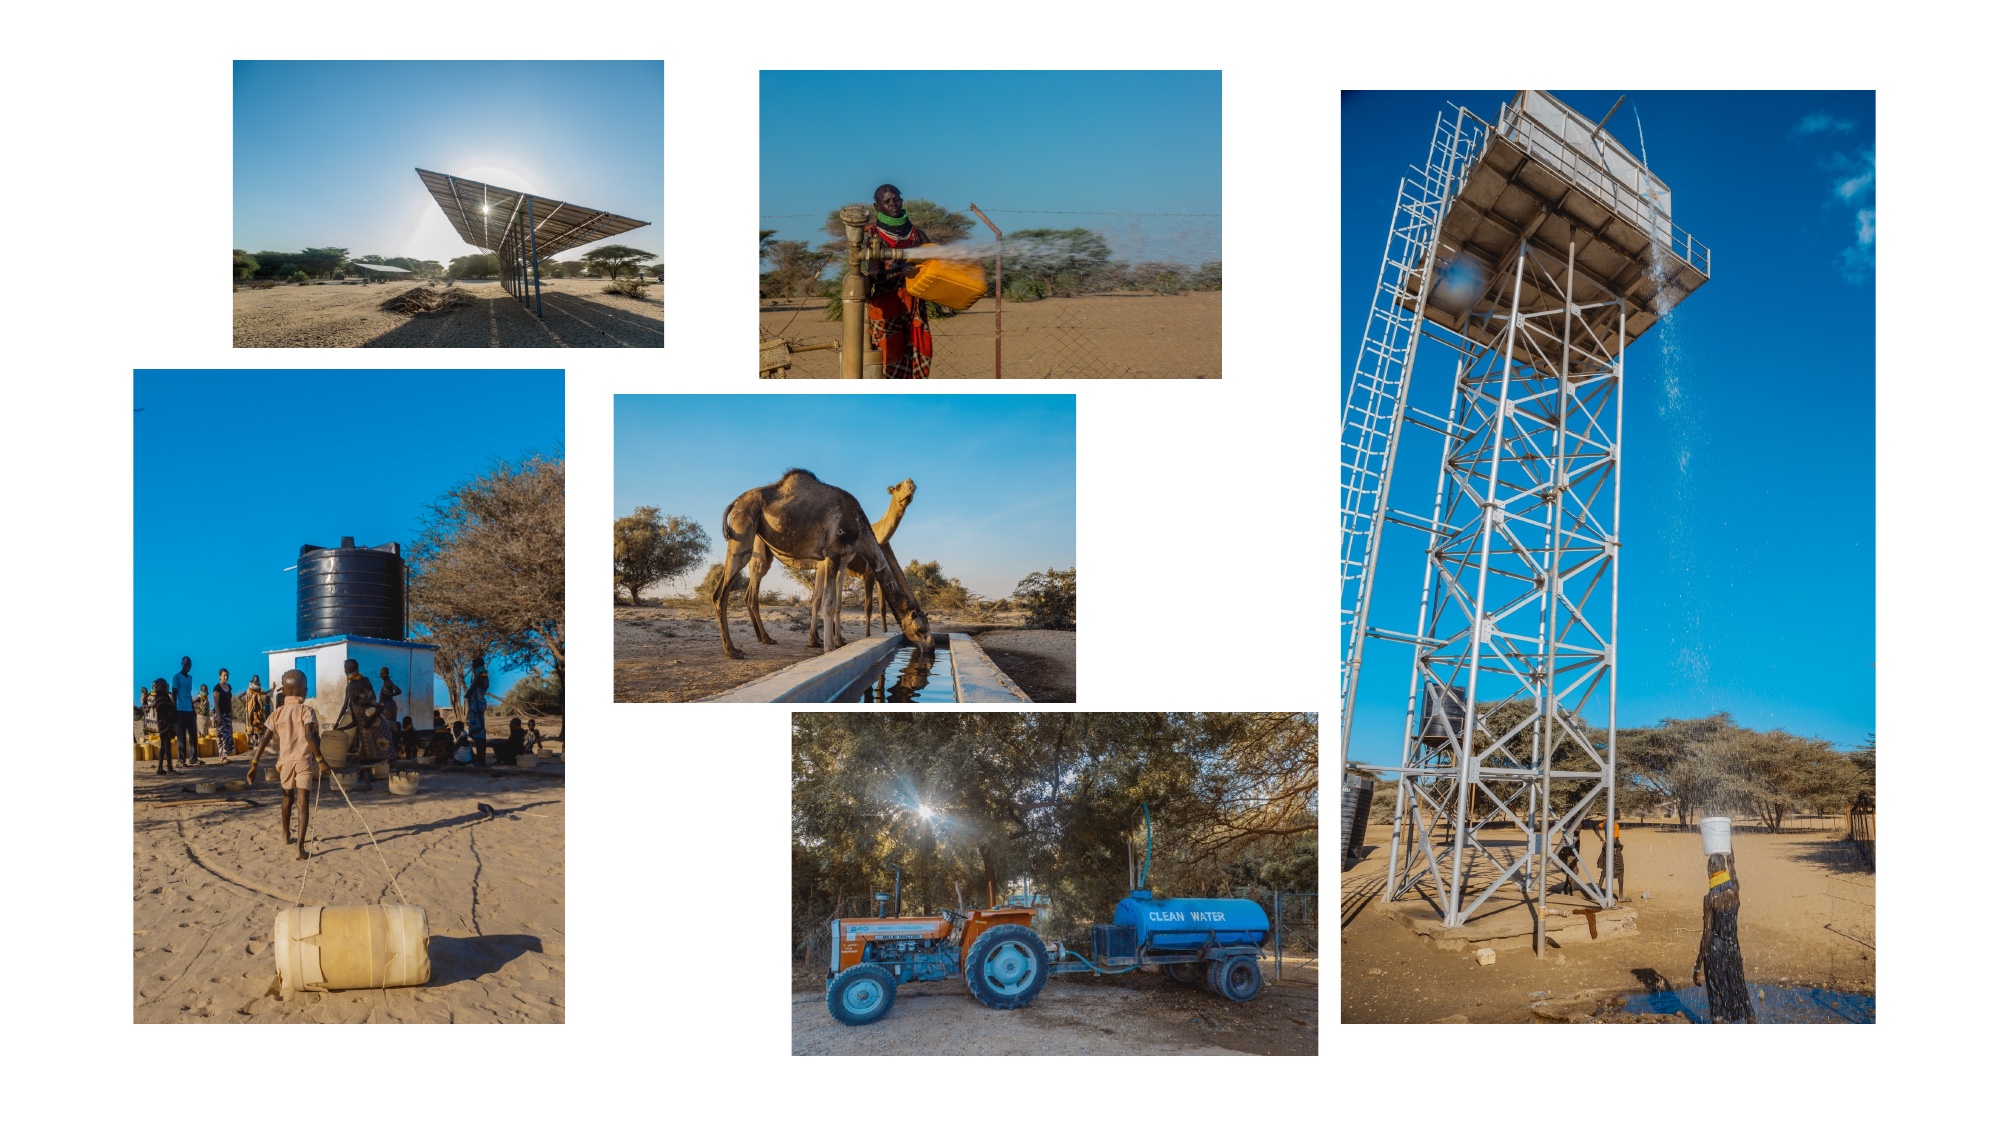
Rural Water Access, Kenya
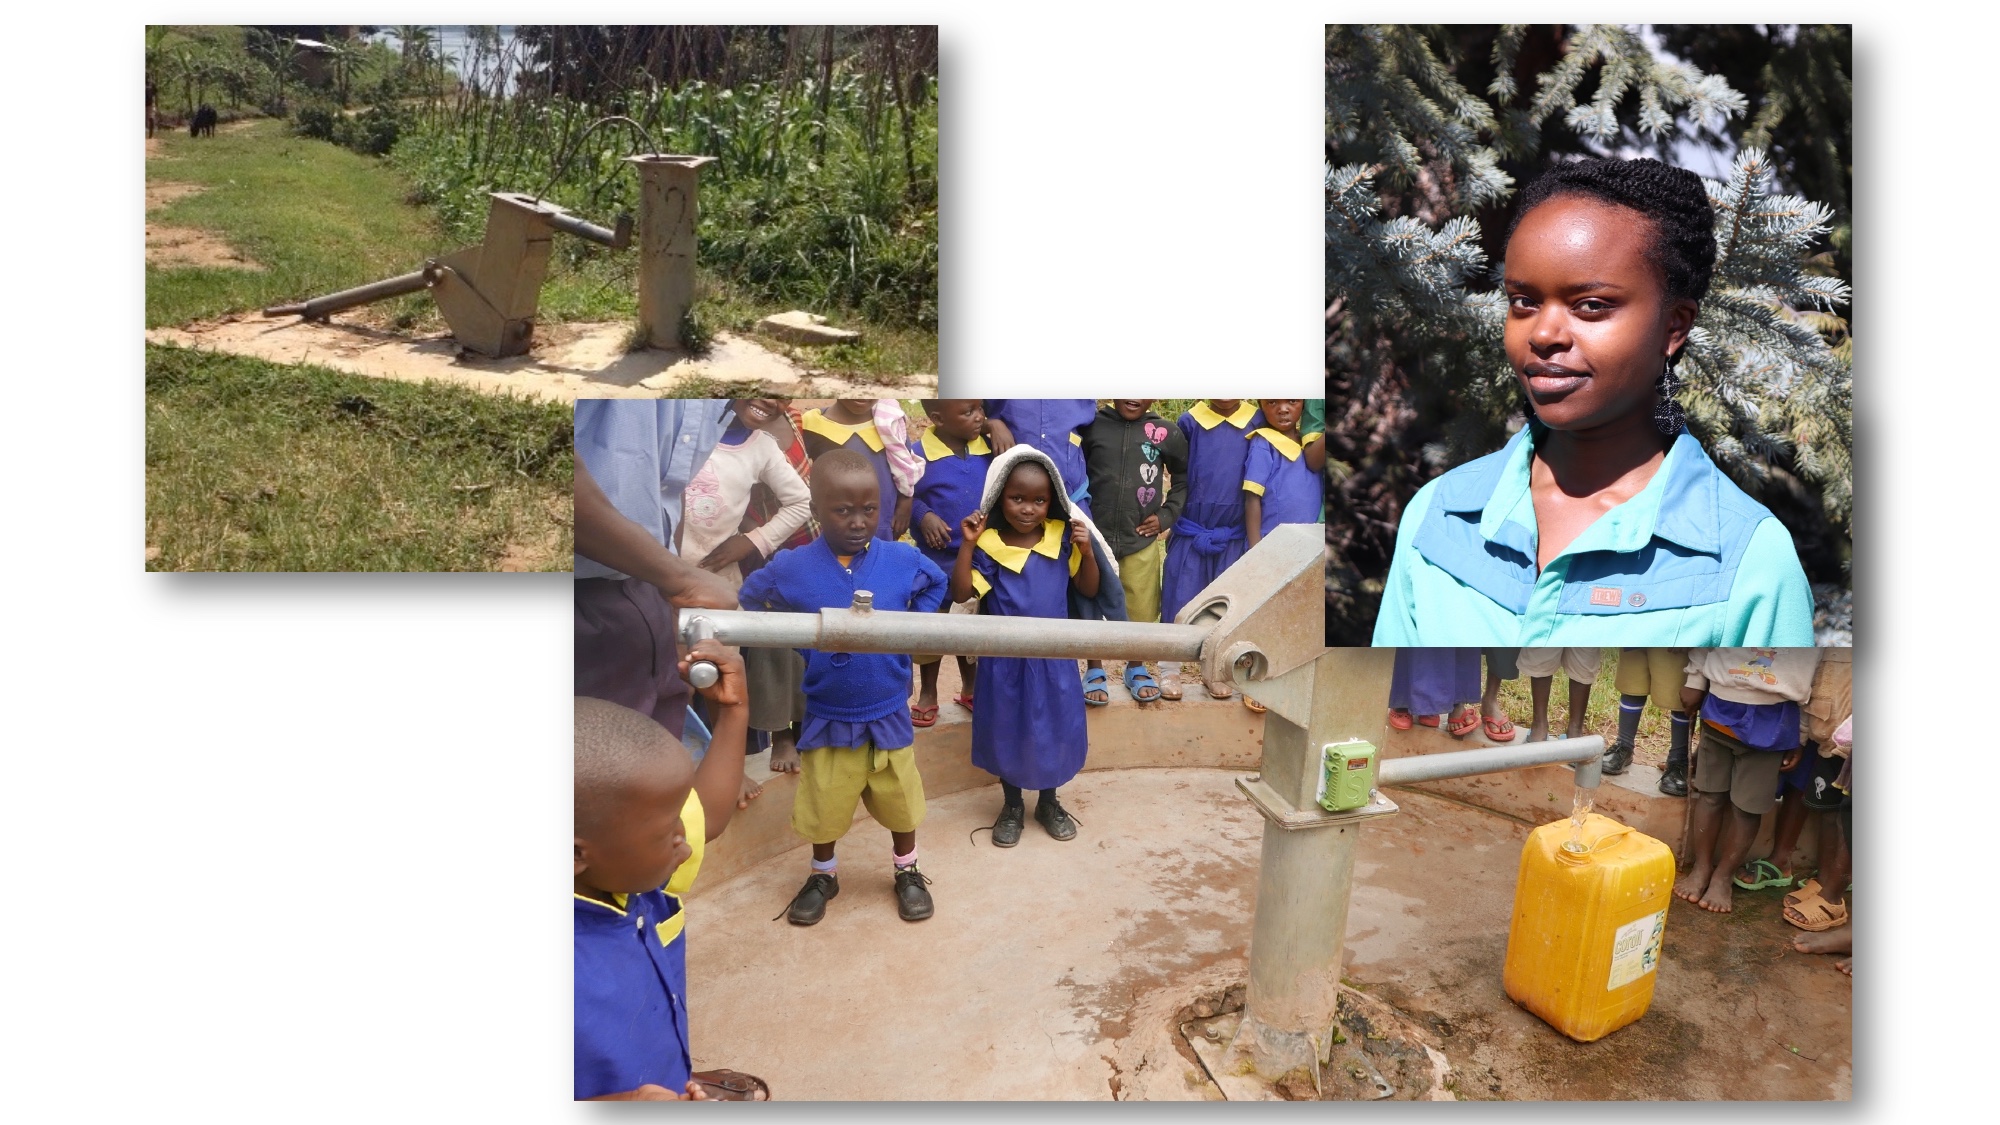
Monitoring borehole water points in arid pastoral regions. IoT sensors verify functionality and usage for carbon credit verification.
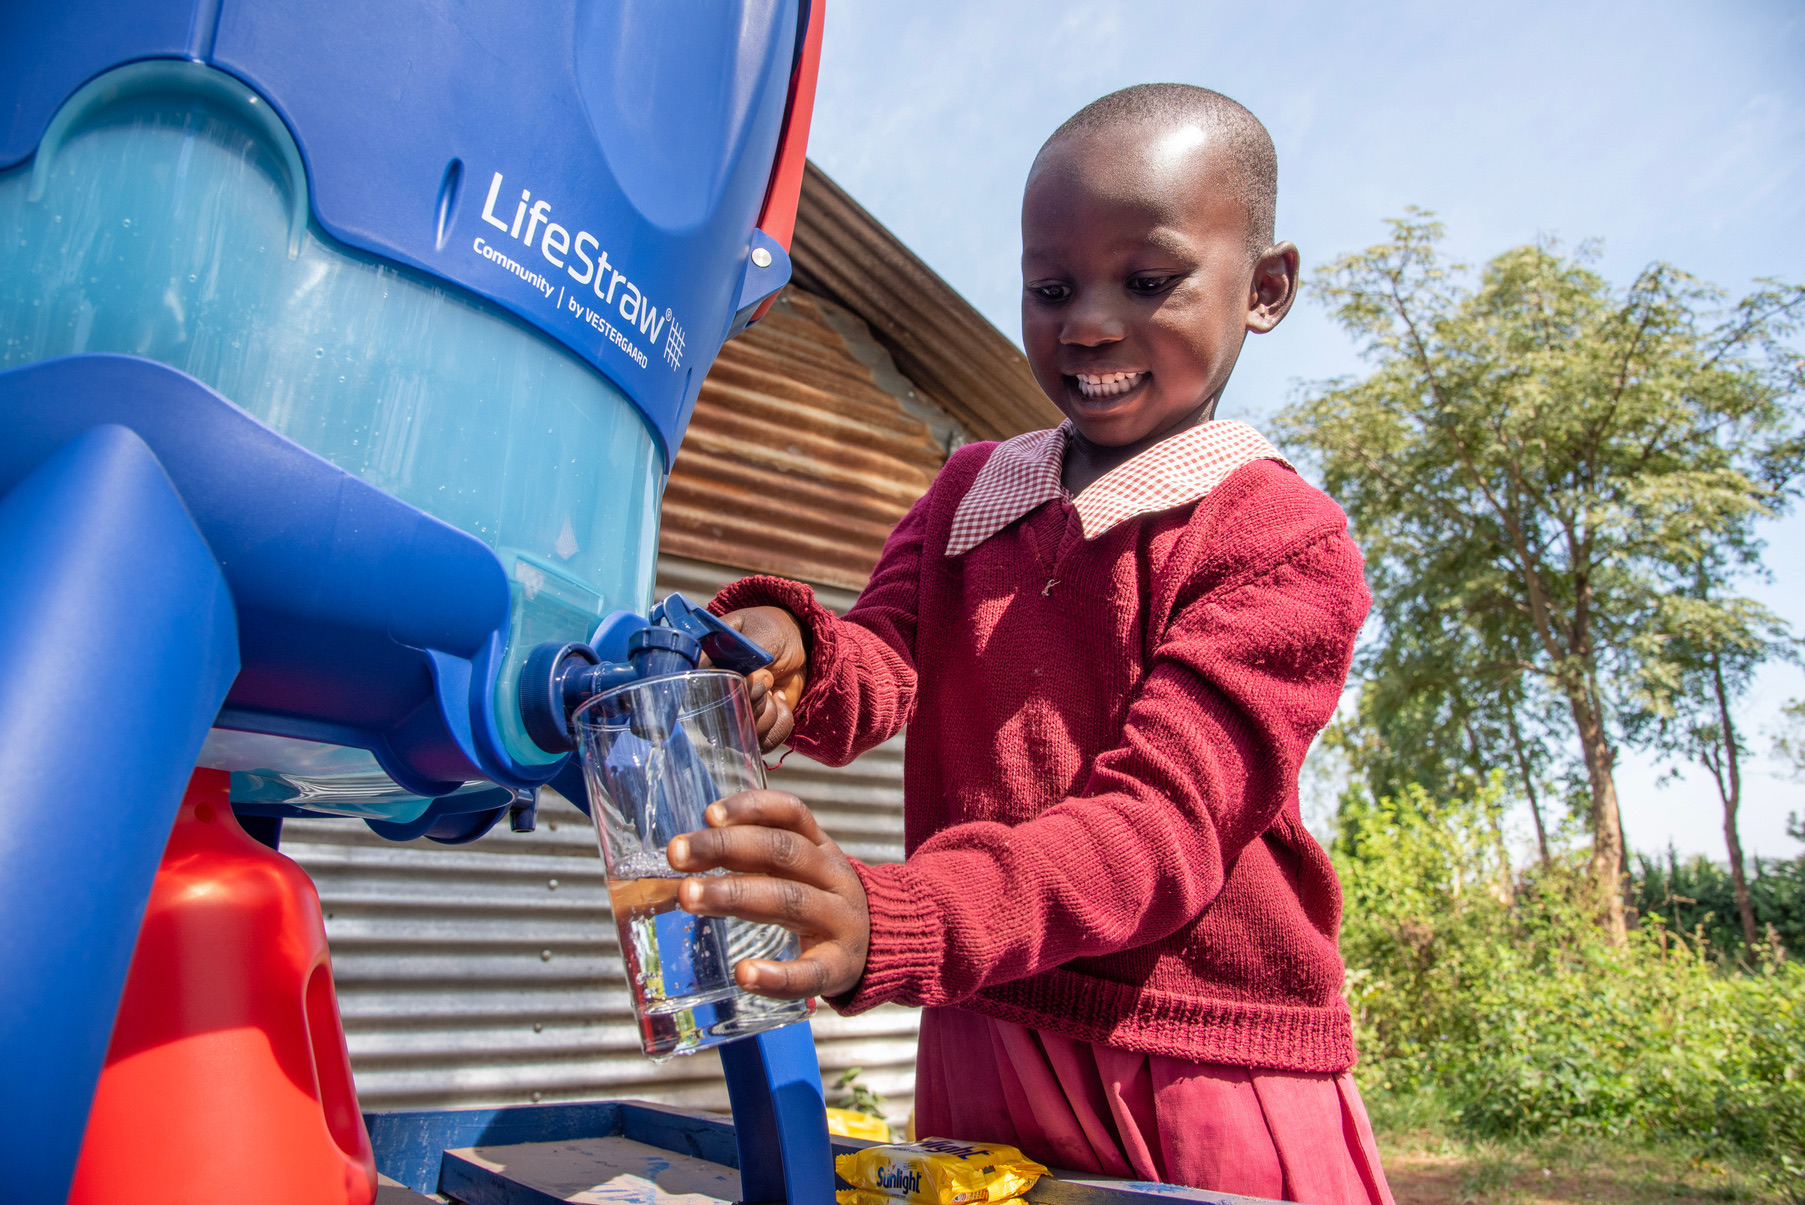
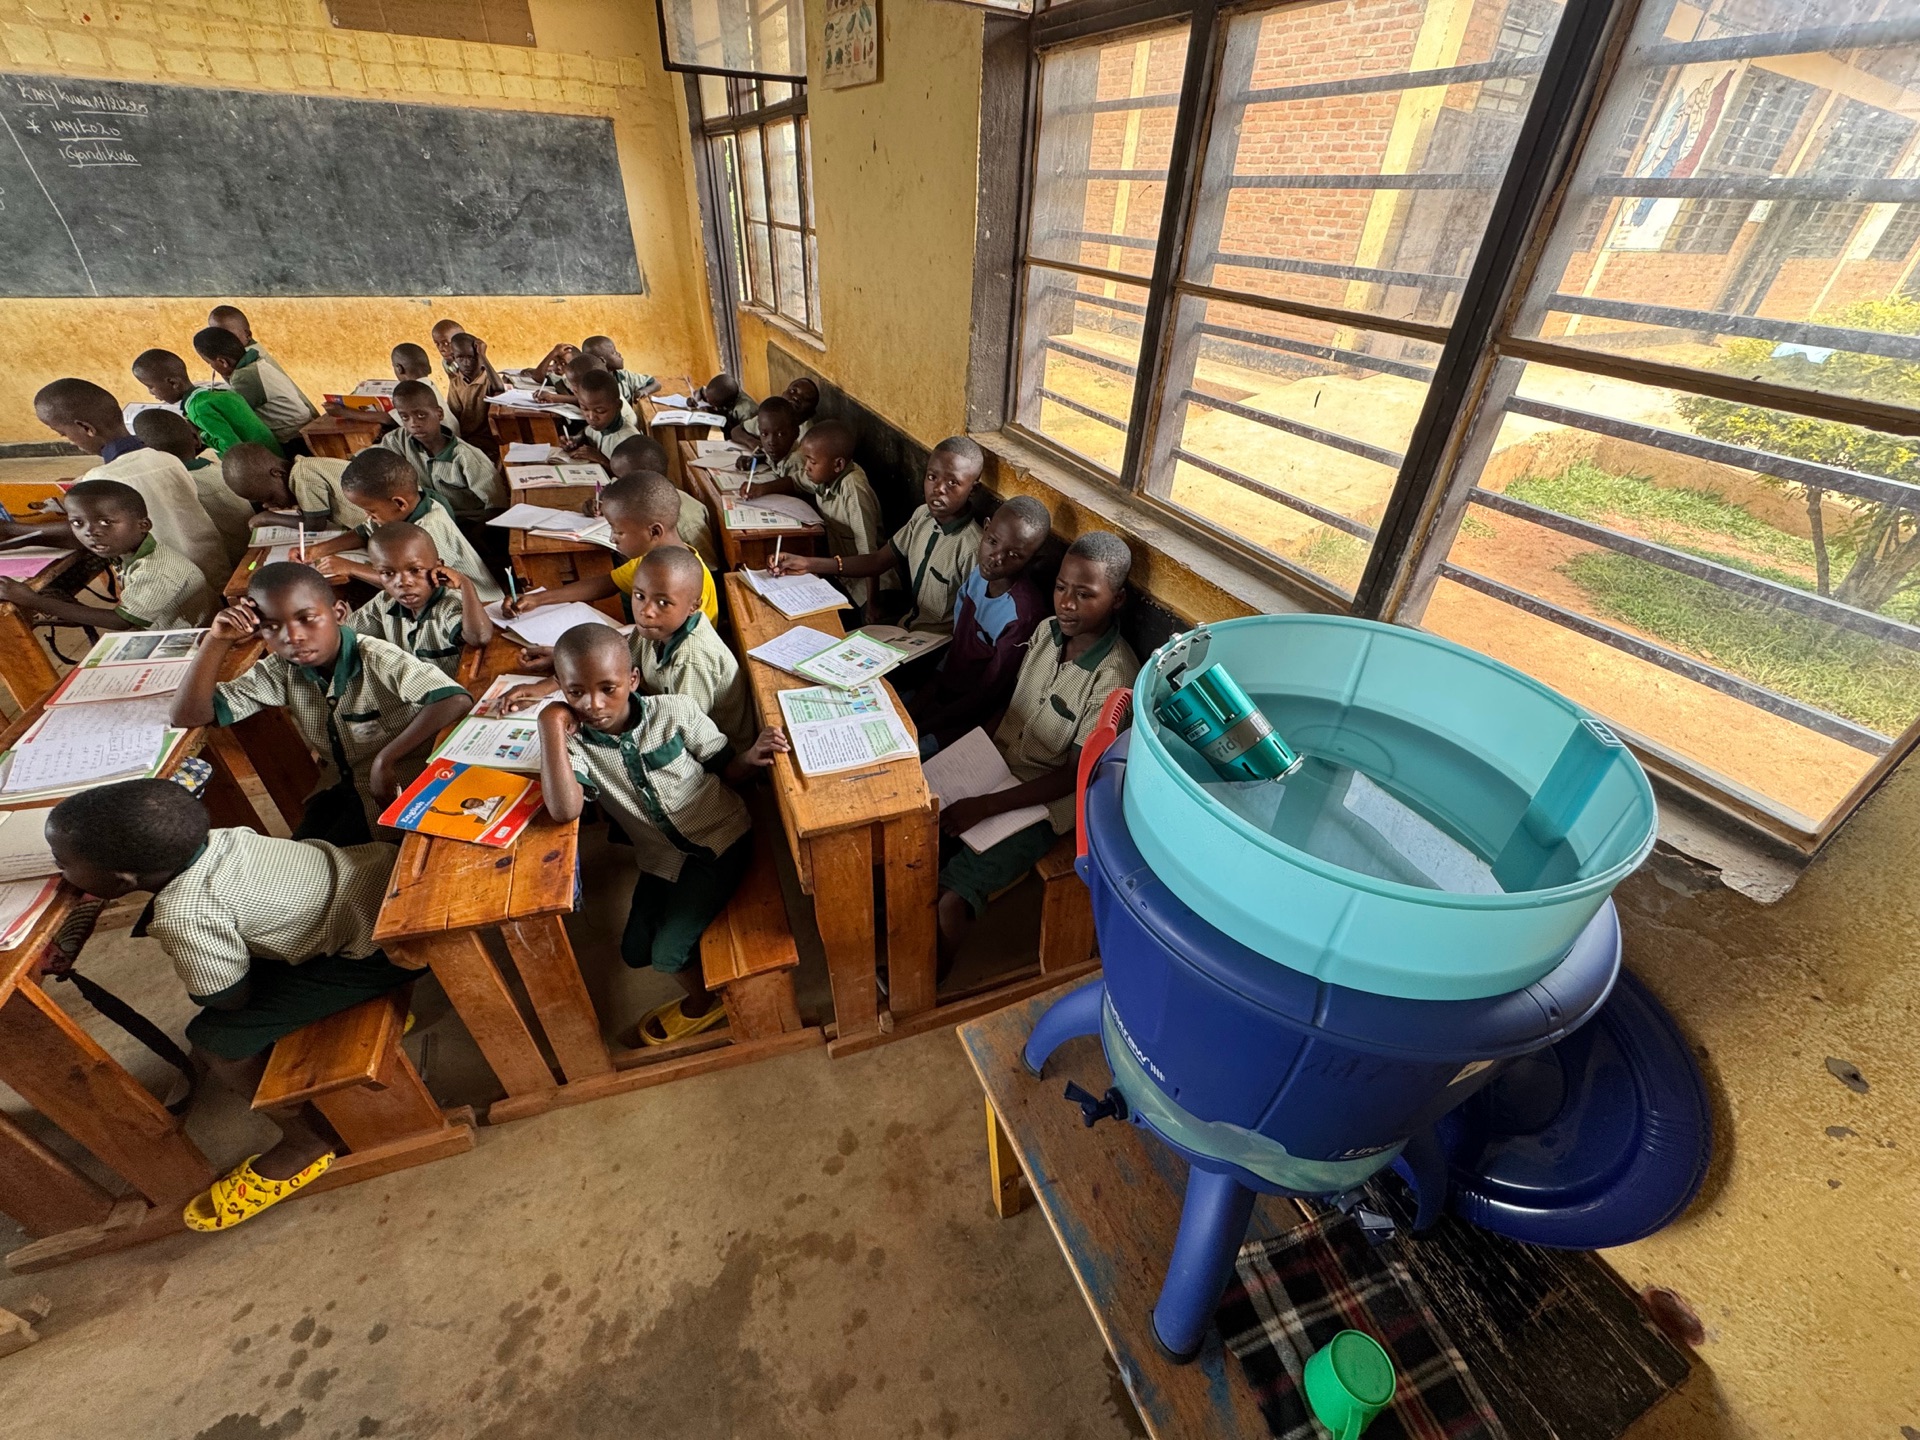
Clean Water in Schools
LifeStraw water purifiers monitored by Virridy sensors in classrooms across Kenya — supporting access to safe drinking water and verified carbon credits.
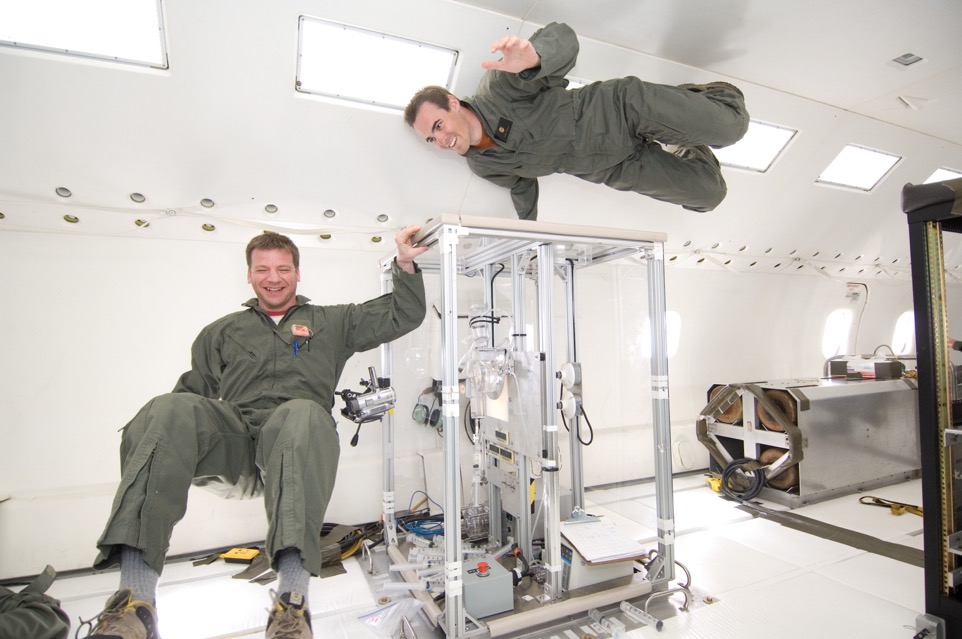
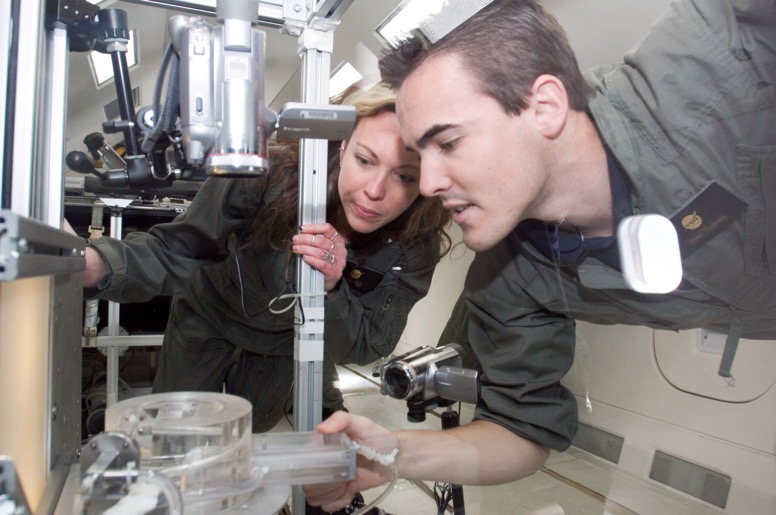
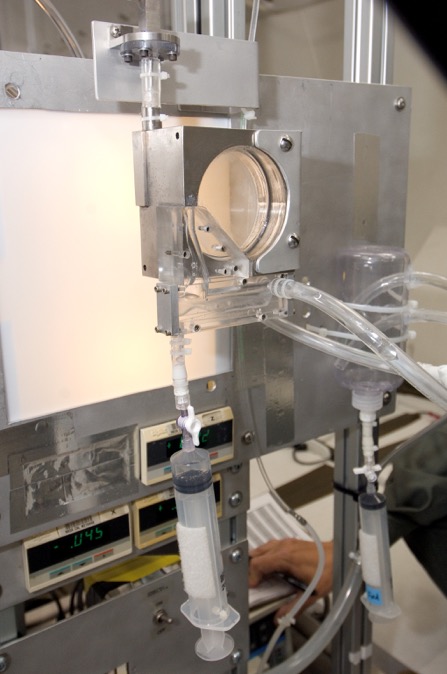
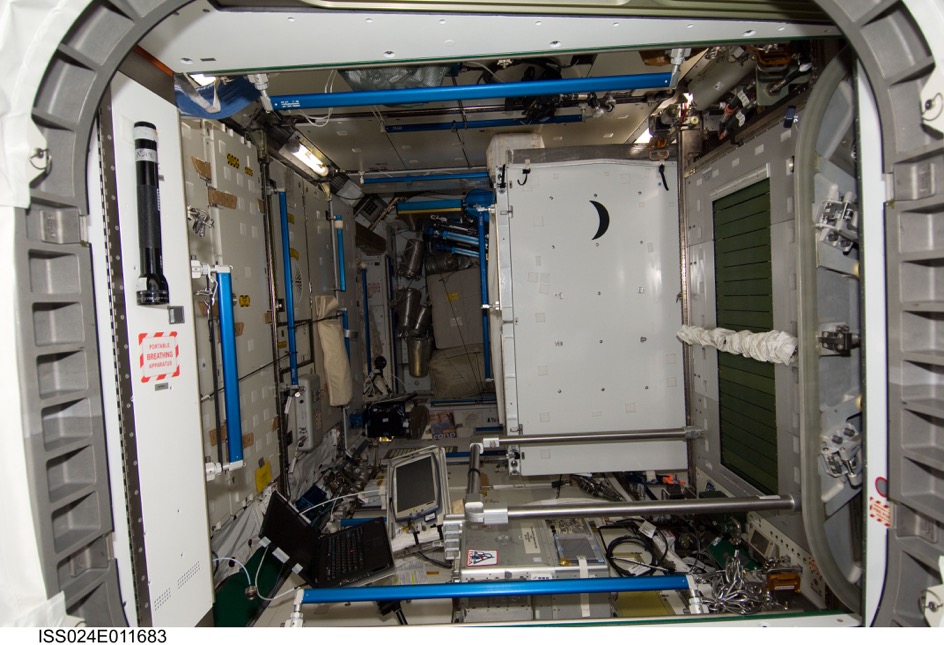
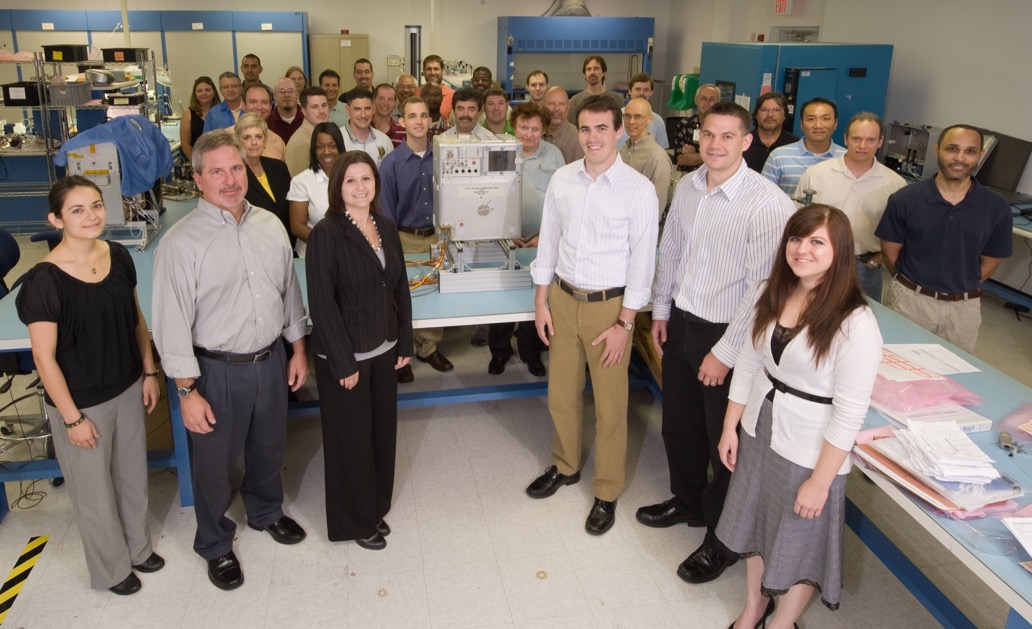
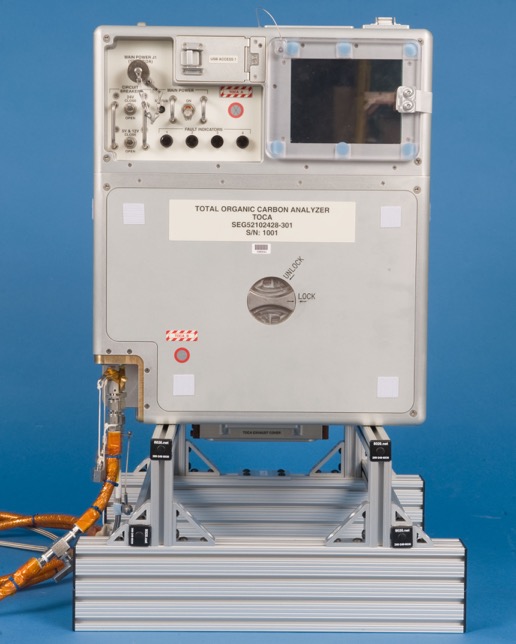
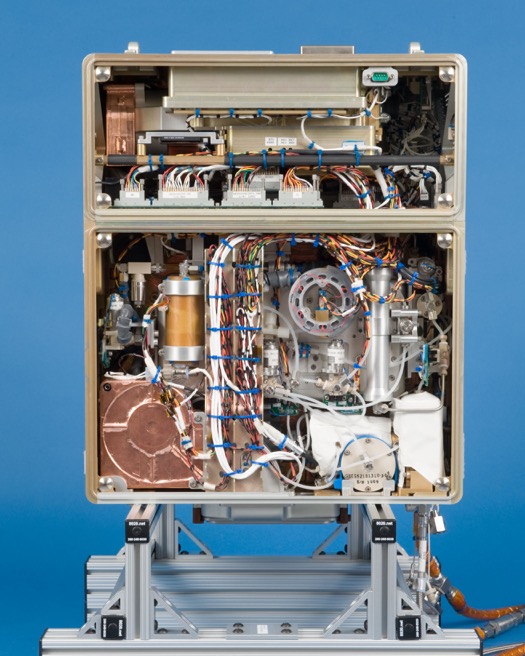
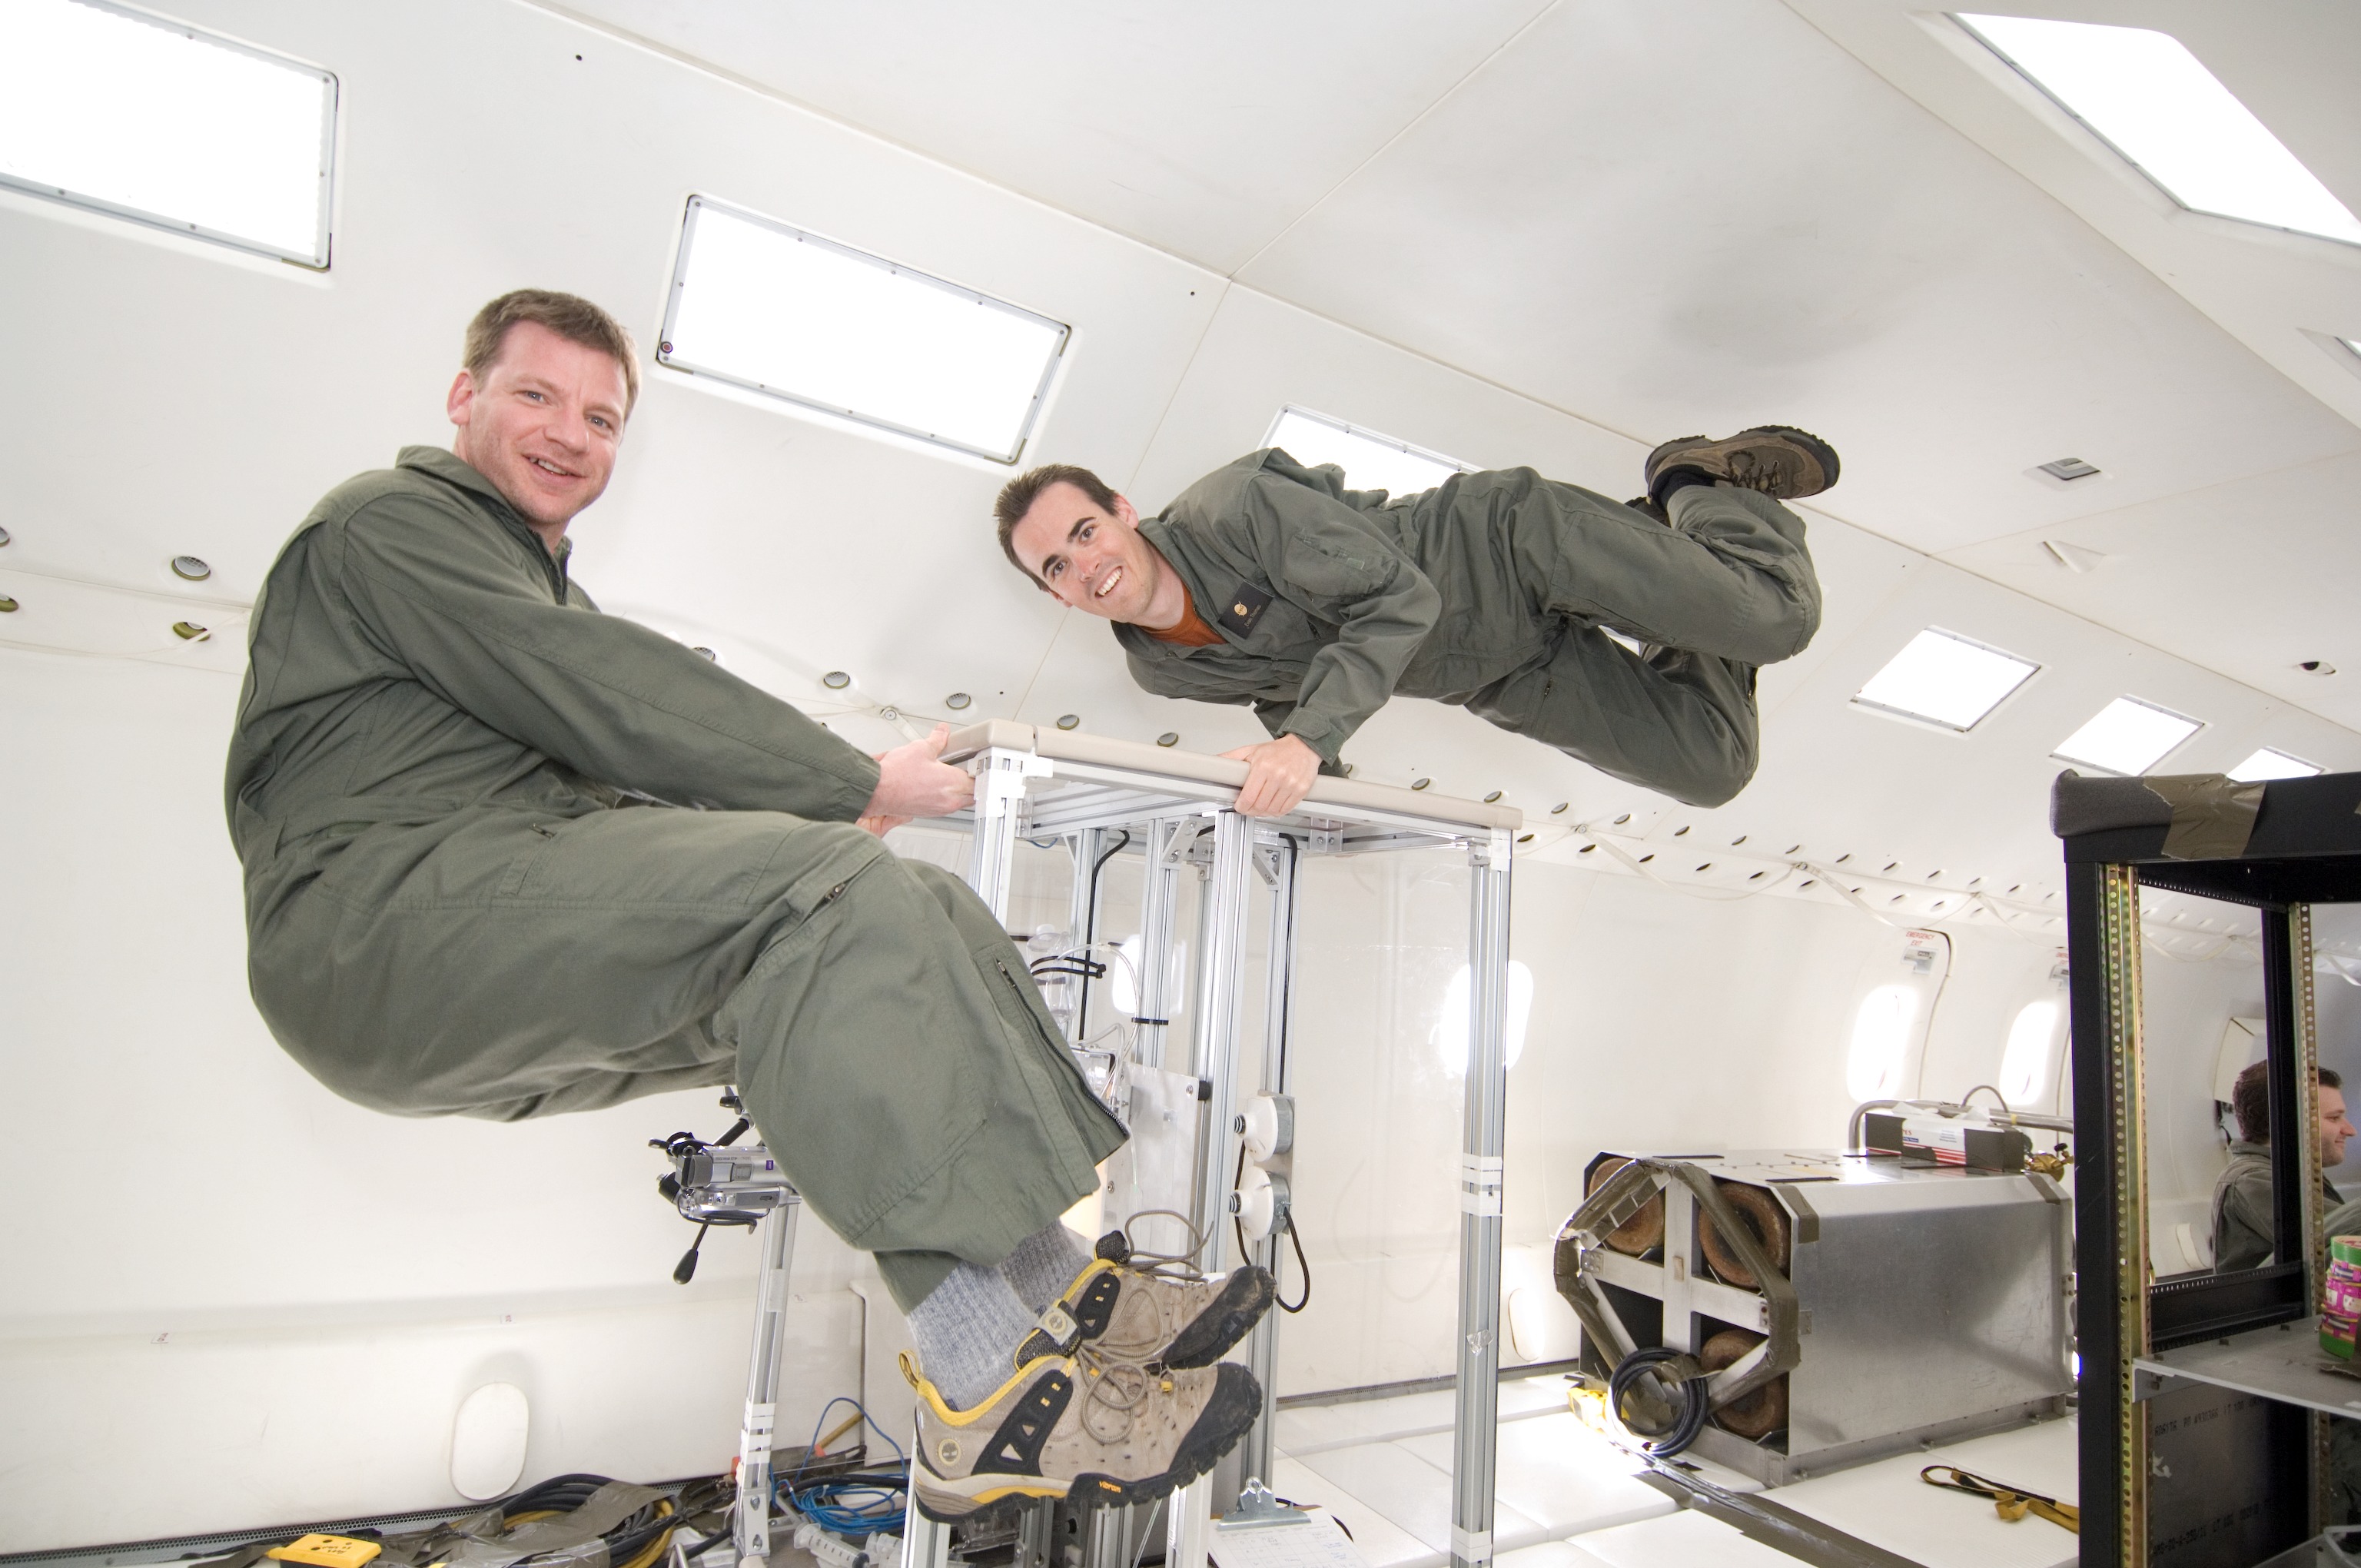
My early career was as an Aerospace Engineer at NASA in Houston, where I designed drinking water systems for astronauts. This is what NASA calls the "Weightless Wonder" — but since I don't work there anymore, I can call it by its real name: the Vomit Comet. This is where we test technologies in reduced gravity before sending them to space.
Astronauts on the Space Station need the same things we do — shelter, food, air, and clean water. But water is incompressible, so it's really hard to pack it down and send it up on a rocket. It costs about $20,000 per liter of water sent to the Space Station. So instead, we recycle it. Every day, we collect the respiration, perspiration, and urination of every astronaut and recycle it back into drinking water. Today's coffee was also your buddy's coffee yesterday. Even with all that engineering, it still costs several thousand dollars for every drink of water on the Space Station. Back here on Earth, we use it like it's free — until it's not.
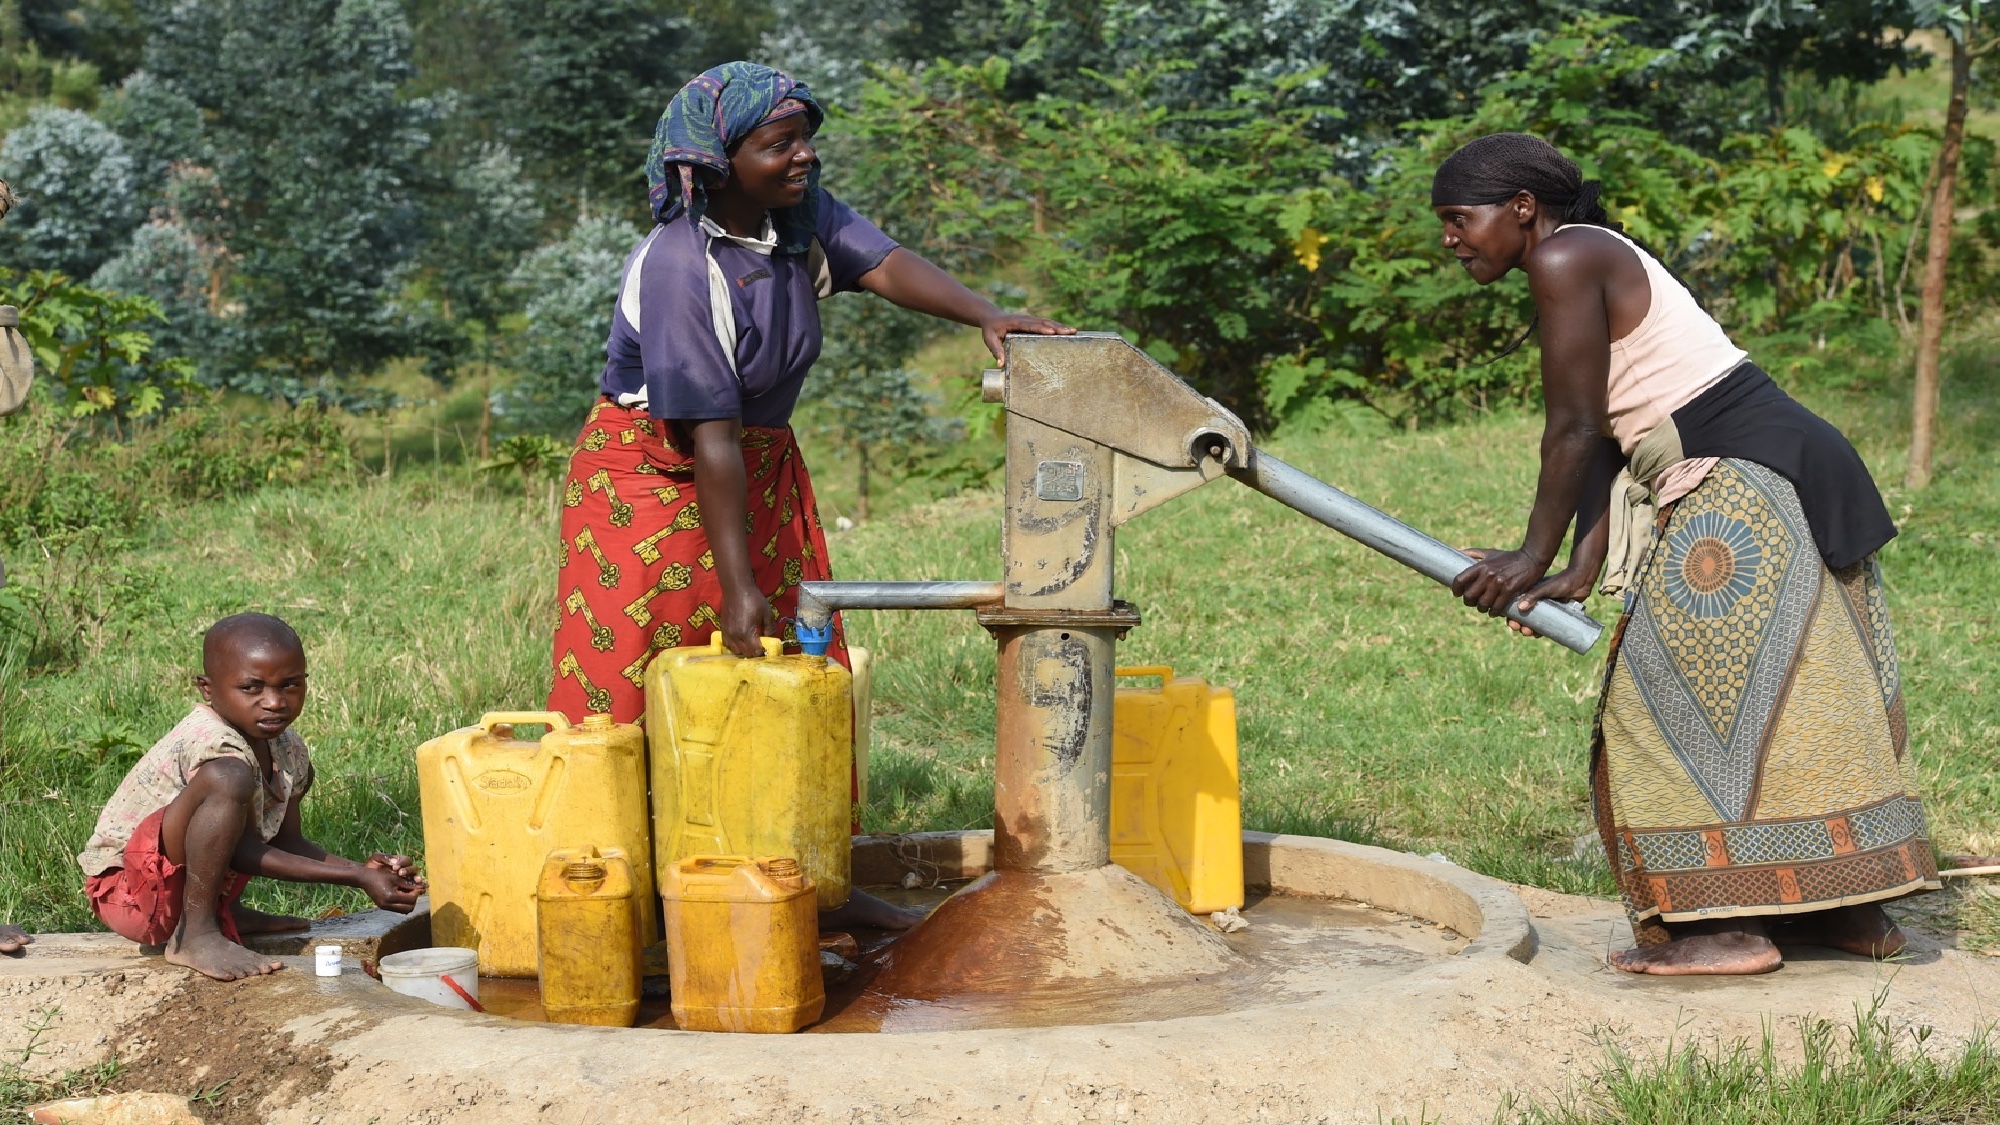
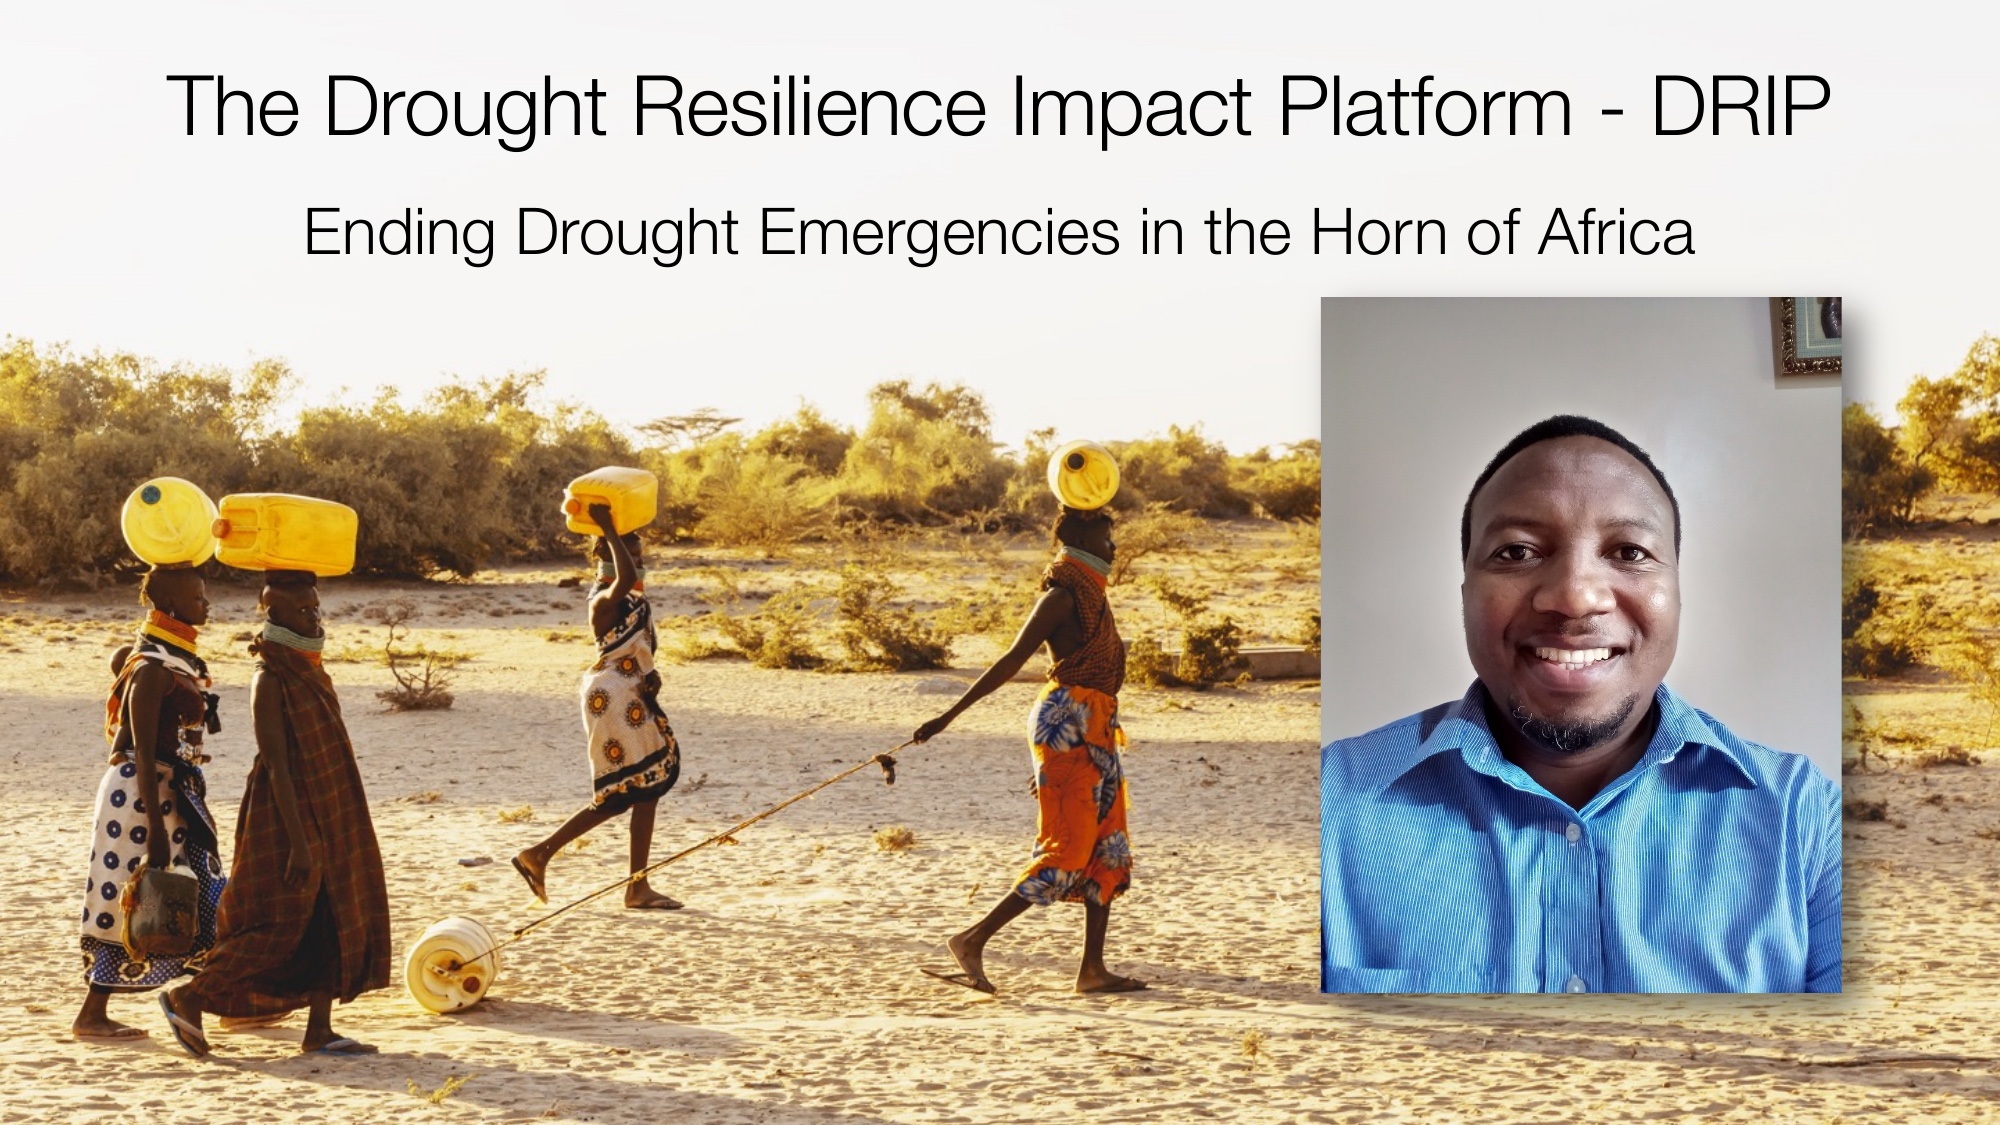
Meanwhile, in places like East Africa, another 40 million people are facing the risk of famine because of what was then the sixth consecutive season of drought. The people in these photos — the women walking miles to collect water, the children at the pumps — are living the direct consequences of a climate they did not create. This is the fieldwork. This is where the data has to come from. Every sensor we deploy here is one data point in a continent that has almost none.
These programs have reached over five million people with clean water, and mobilized over $70 million in private and public investment — from venture capital, carbon credit buyers, NASA, and USAID — while generating over $100 million in returns. People are getting clean water in places where governments and donors can't reach. Investors take a risk, millions of people benefit, and companies see a modest return. That's the model.
These carbon credits are also a form of climate reparations. We caused climate change. People around the world are now feeling its effects. By taking money from carbon-emitting corporations to provide a basic water service, we are using capitalism to repair water supplies damaged by capitalism. The numbers on this slide are what that looks like in practice — not in theory.
Measuring Global
Water Security.
Every SDG Needs Measurement
Different goals, different sensors, different data — same logic. Continuous, auditable measurement is the precondition for anyone being held accountable for outcomes on any SDG.
& Sanitation
& Well-being
Action
Energy
Innovation
Inequalities
Land
for the Goals
We need more measurement. Then we need to ask who acts on it.
Data without incentives is just storage. The hard problem isn’t the sensor — it’s building the accountability structures that make someone responsible for what the sensor finds.
4 billion people drink contaminated water. Sub-Saharan Africa has almost no monitoring data. The first step is simply knowing — and for most of the world, we still don’t.
Deep-UV fluorescence. On-device ML. No calibration. 91% accuracy at WHO thresholds. Continuous water quality records in Kenya and Rwanda where none existed before. The technology barrier is solved.
Regulatory mandates, performance contracts, carbon credits, donor accountability — these are the mechanisms that make someone responsible for acting on data. Without them, dashboards are just dashboards.
The sensors exist. The data is starting to flow. The open question is whether the policy, financing, and institutional structures exist to make acting on that data someone’s job.
I want to be precise about what I'm arguing. I'm not saying measurement solves the problem — data sitting in a dashboard does nothing. What I'm saying is that we need far more of it than we have, and then we need to be honest about the second question: who is actually incentivized to act on what it shows?
Right now, in most of the world, nobody is. There's no operator whose contract depends on the water quality reading. No regulator whose mandate covers the borehole in Turkana. No investor whose return is tied to whether the filter is being used. Carbon credits, performance-based contracts, regulatory mandates — these are the mechanisms that change that. The technology barrier is largely solved. The institutional and incentive barrier is not.
Measuring Global
Water Security.
The gap between what we can now measure and what we choose to act on is a policy and business model problem — not a technology one.
thelume.ai/boulder/stormevent
DRIP Kenya & Amazi Meza Rwanda